
Image
|
Figure Caption
Figure 6
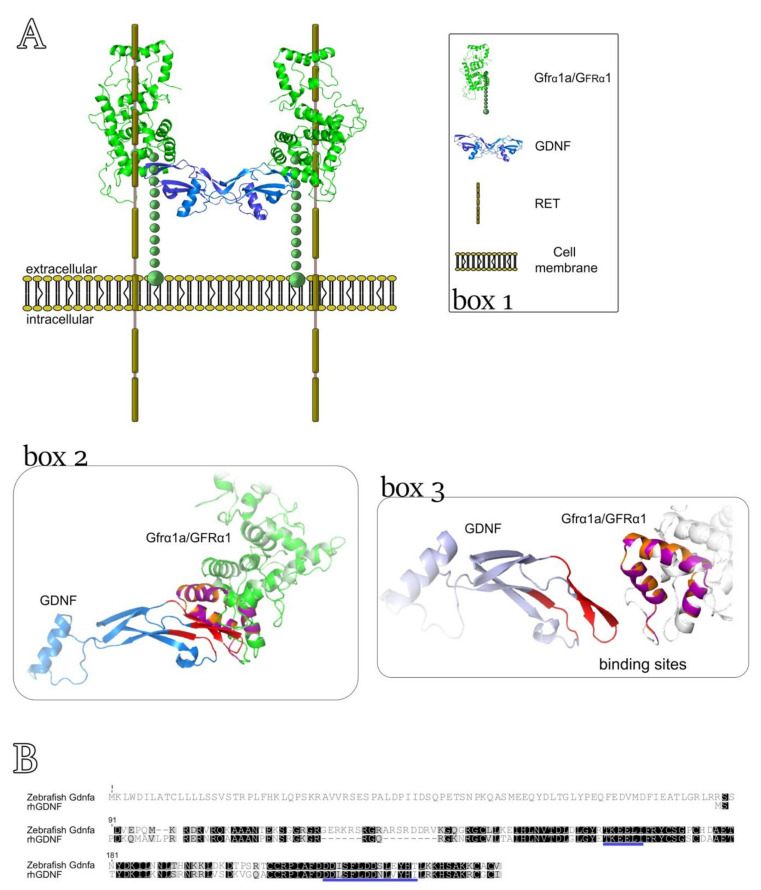
Figure 6. A 3D model to predict the interaction between rhGDNF and zebrafish Gfrα1a. (A) Box 1 depicts the molecular components of the complex GDNF-GFRα1-RET. Boxes 2 and 3 show the predictive 3D model (template 4ux8.1) in which the structural similarities between zebrafish Gfrα1a and human GFRA1 are represented by orange and purple coloring and the identity of the structure formed at the binding sites is indicated in red. In box 2, green is used to indicate the conserved amino acid sequences between zebrafish Gfrα1a and human GFRA1 and blue indicates the GNDF protein. In box 3, we highlighted the interaction sites between human GDNF and zebrafish Gfrα1a/human GFRA1. (B) Alignment of zebrafish Gdnfa with rhGDNF. The blue lines indicate the conserved binding sites to zebrafish Gfrα1a or human GFRA1.
Acknowledgments
This image is the copyrighted work of the attributed author or publisher, and
ZFIN has permission only to display this image to its users.
Additional permissions should be obtained from the applicable author or publisher of the image.
Full text @ Cells