FIGURE SUMMARY
Title

Genoarchitecture of the Early Postmitotic Pretectum and the Role of Wnt Signaling in Shaping Pretectal Neurochemical Anatomy in Zebrafish

Authors
Brożko, N., Baggio, S., Lipiec, M.A., Jankowska, M., Szewczyk, Ł.M., Gabriel, M.O., Chakraborty, C., Ferran, J.L., Wiśniewska, M.B.
Source
Full text @ Front. Neuroanat.

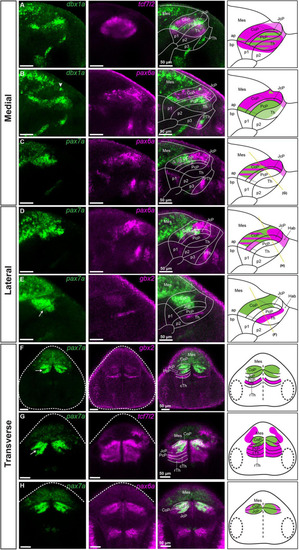
Identification of pretectal boundaries in the diencephalon of 48 hpf zebrafish. Confocal Z-stack images showing brain sections stained using in situ hybridization with nkx2.2a, lhx9, tcf7l2 and gbx2 probes. Sagittal sections: (A–D) Expression of nkx2.2a and lhx9 in medial (A,B) and lateral (C,D) sections delineate the alar-basal boundary. Also, nkx2.2a expression identifies the rTh and Pth, while lhx9 expression identifies the cTh and Hab. (E,F) Expression of tcf7l2 identifies prosomere 1 and 2; co-staining of tcf7l2 and gbx2 identifies the cTh. Transverse sections:(G,H)tcf7l2 co-stained with gbx2 and nkx2.2a marks the Pt, Hab, cTh, and rTh. The schemes show the regions identified by the markers in each merged image. Stripe pattern indicates co-expression of two markers; saturated color indicates high expression signal while lighter color indicates low signal. The yellow lines in (E,F) show the sectioning plane of the transverse sections in (G,H). Ap, alar plate; bp, basal plate; Hab, habenula; Mes, mesencephalon; p1, prosomere 1; p2, prosomere 2; p3, prosomere 3; Pt, pretectum; Pth, prethalamus; Rh, rhombencephalon; cTh, caudal thalamus; rTh, rostral thalamus.

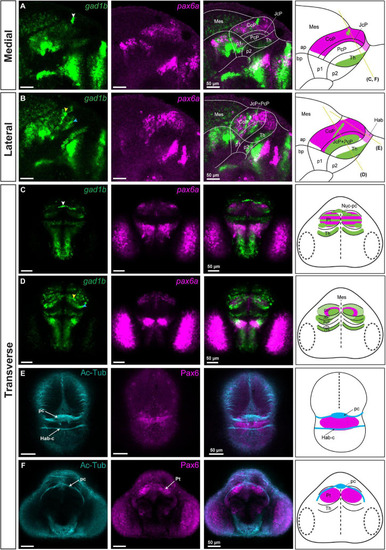
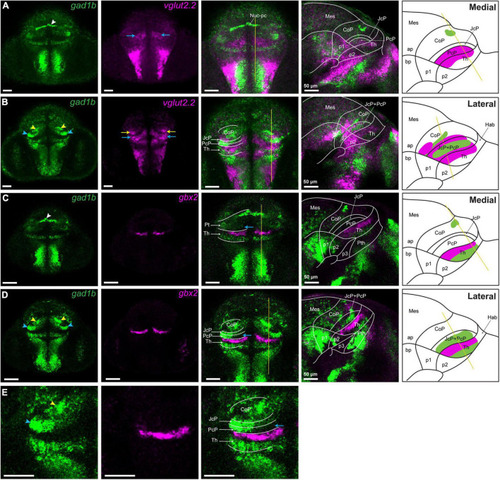
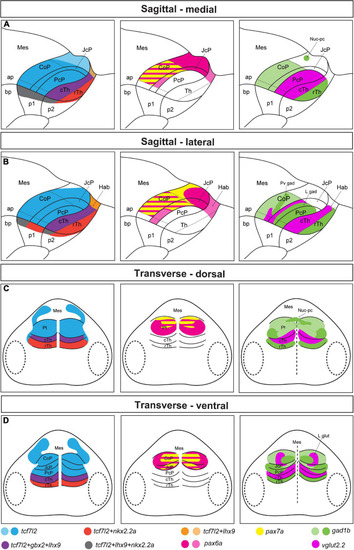
Subdivisions of the pretectum in the brain of 48 hpf zebrafish. Confocal Z-stack images showing brain sections stained using in situ hybridization with dbx1a, pax6a, pax7a, gbx2 and tcf7l2 probes. Sagittal sections: (A)dbx1a expression identifies the PcP in the area of tcf7l2 expression. (B) Co-staining of dbx1a and pax6a shows the alar-basal boundary in prosomere 1 and identifies the pax6a-positive area as the CoP and JcP. (C,D) Co-staining of pax7a and pax6a differentiates between the dorsal, central, and ventral subdomains in the Pt. (E) Staining of pax7a identifies the CoP and JcP and staining of gbx2 identifies cTh in the lateral section. Transverse sections: (F–H)pax7a and gbx2 identify the pretectal domains and the cTh (F), while tcf7l2 stains the Pt and Th (G), and pax6a identifies the CoP and JcP (H). The schemes show the regions identified by the markers in each merged image, with the Pt divided into three rostrocaudal domains: PcP, JcP, and CoP. Stripe pattern indicates co-expression of two markers; saturated color indicates high expression signal while lighter color indicates low signal. The yellow lines (C–E) show the sectioning plane of the transverse sections (F–H). The white arrowhead shows the dbx1a cluster in the dorsal pretectum (B). The white arrow shows the pax7-negative area between the CoP and JcP. ap, alar plate; bp, basal plate; Hab, habenula; Mes, mesencephalon; p1, prosomere 1; p2, prosomere 2; p3, prosomere 3; Pt, pretectum; PcP, precommissural pretectum; JcP, juxtacommissural pretectum; CoP, commissural pretectum; Pth, prethalamus; Th, thalamus; cTh, caudal thalamus; rTh, rostral thalamus; Rh, rhombencephalon.

gad1b-positive GABAergic clusters and the identification of Nuc-pc in relation to commissures in the diencephalon of 48 hpf zebrafish. Images showing brain sections stained using immunofluorescence with antibodies specific for acetylated-tubulin and Pax6 (Pax6a and Pax6b), and in situ hybridization with gad1b and pax6a probes. (A,B) In sagittal sections, gad1b and pax6a staining identifies a gad1b-high GABAergic cluster in the dorsal CoP (A, medial section) and two gad1b-high clusters in the central subdomain of the rostral Pt (PcP and JcP) and CoP (B, lateral section). (C) In dorsal sections, co-staining of pax6a and gad1b identifies the gad1b-high cluster as the posterior commissure associated Nuc-pc. (D) In ventral sections, co-staining of pax6a and gad1b identifies a periventricular gad1b-high cluster in the CoP and a lateral gad1b-high cluster in the rostral Pt. (E,F) Acetylated tubulin and Pax6-positive staining identifies the habenular commissure (E) and posterior commissure (F) in transverse sections. White, yellow and blue arrowheads indicate the dorsocaudal, periventricular and lateral gad1b GABAergic clusters, respectively. The schemes depict gad1b-high clusters and the regions identified by the markers in each merged image. Yellow lines show the sectioning plane of the transverse sections. The stripe pattern indicates a co-expression of two markers in a region. ap, alar plate; bp, basal plate; Hab, habenula; Hab-c, habenular commissure; Mes, mesencephalon; Nuc-pc, nucleus of the posterior commissure; pc, posterior commissure; Pt, pretectum; CoP, commissural pretectum; JcP, juxtacommissural pretectum; PcP, precommissural pretectum; p1, prosomere 1; p2, prosomere 2; p3, prosomere 3; Th, thalamus; cTh, caudal thalamus; rTh, rostral thalamus; Pt, pretectum.

vglut2.2-positive glutamatergic clusters in the pretectum of 48 hpf zebrafish. Confocal Z-stack images showing brain sections stained using in situ hybridization with gad1b,vglut2.2 and gbx2 probes. (A,B) Co-staining of gad1b and vglut2.2 identifies vglut2.2-positive glutamatergic areas in the diencephalon. Low gad1b signal is present throughout the central domain of CoP. (C,D) Co-staining of gad1b and gbx2 identifies the cTh and rTh by the gad1b expression. (E) Magnification of gad1b and gbx2 ventral sections shows the boundary between Pt and Th. White, yellow and blue arrowheads indicate the dorsocaudal, periventricular and lateral gad1b GABAergic clusters, respectively. Yellow and blue arrows indicate vglut2.2 positive glutamatergic clusters in the CoP and PcP, respectively. The schemes depict the regions identified by the markers in each merged sagittal image. ap, alar plate; bp, basal plate; Hab, habenula; Mes, mesencephalon; Nuc-pc, nucleus of posterior commissure; Pt, pretectum; CoP, commissural pretectum; JcP, juxtacommissural pretectum; PcP, precommissural pretectum; p1; prosomere 1; p2, prosomere 2; p3, prosomere 3; Th, thalamus, cTh, caudal thalamus, rTh, rostral thalamus.

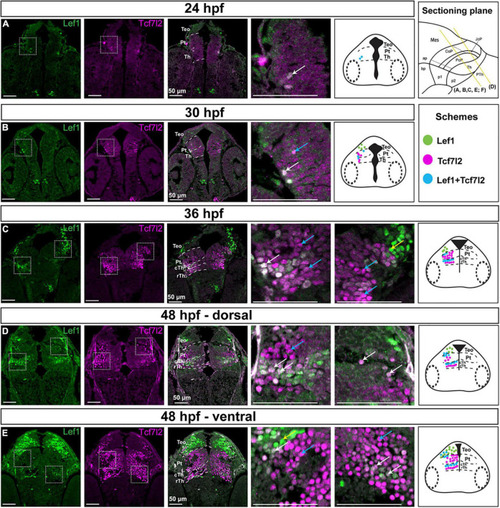
Spatiotemporal expression of the Lef1 and Tcf7l2 proteins in the brain of zebrafish embryos (24–48 hpf). Images showing brain sections from different developmental stages immunostained with antibodies specific for Lef1 and Tcf7l2. (A) 24 hpf:: Tcf7l2-positive cells are detected in the area of the diencephalon mantle zone; lef1 is not expressed in the diencephalon. (B)30 hpf: more Tcf7l2-positive and few Lef1-positive cells are detected in the area of the diencephalon mantle zone. (C) 36 hpf: Lef1-positive cells are visible in the mantle zone in the cTh, caudolateral edge of the Pt and TeO, while Tcf7l2-positive cells are present throughout the Th and Pt with high Tcf7l2 signal in the mantle zone. (D,E) 48 hpf: Lef1-positive cells are visible in the cTh and caudolateral edge of the Pt in the dorsal section (D), being less numerous in the cTh in the ventral section (E), Tcf7l2-positive cells are detected throughout the Th and Pt, being more numerous in ventral sections (E). Yellow lines show the sectioning plane of the sagittal sections in (A–E). Blue arrows point to Tcf7l2-positive cells, yellow arrows point to Lef1-positive cells and white arrows point to double-positive Lef1/Tcf7l2 cells in magnified images. The schemes represent the spatiotemporal distribution of Lef1-positive (green dots), Tcf7l2-positive (magenta dots), and double-positive Lef1/Tcf7l2 (blue dots) cells. Pt, pretectum; TeO, optic tectum; Th, thalamus; cTh, caudal thalamus; rTh, rostral thalamus.

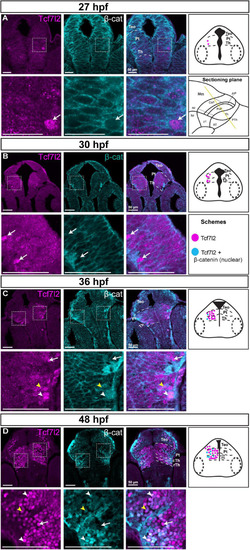
Spatiotemporal expression and subcellular localization of β-catenin in the brain of zebrafish embryos (27–48 hpf). Images showing brain sections from different developmental stages immunostained with antibodies specific for Tcf7l2 and β-catenin. (A,B) 27 and 30 hpf: Tcf7l2 is present in a few cells in the diencephalon mantle zone, while the β-catenin protein is localized only in cell membranes throughout the diencephalon. (C) 36 hpf: Tcf7l2-positive cells are present throughout the Th and Pt with high Tcf7l2 signal in the mantle zone; β-catenin is localized in cell membranes in the ventricular/periventricular area while its subcellular localization in the diencephalon mantle zone is not clear. (D) 48 hpf: Tcf7l2- positive cells are visible throughout the Th and Pt; β-catenin is localized in cell nuclei in the cTh and Pt, being high in superficial areas. Yellow lines show the sectioning plane of the sagittal sections in (A–D). White arrowheads indicate Tcf7l2-positive cells with high level of nuclear β-catenin, yellow arrowheads indicate Tcf7l2-positive cells with low level of nuclear β-catenin, white arrows indicate Tcf7l2-positive cells with no β-catenin in the nuclei. The schemes represent the spatiotemporal distribution of Tcf7l2-positive (magenta dots), and Tcf7l2-positive cells with nuclear β-catenin (blue dots) cells. Pt, pretectum; TeO, optic tectum; Th, thalamus; cTh, caudal thalamus; rTh, rostral thalamus.

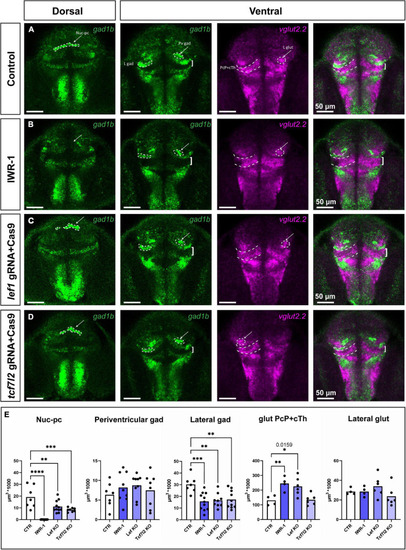
Phenotypes in the pretectum of IWR-1-treated, lef1 crispant and tcf7l2 crispant zebrafish at 48 hpf. Confocal Z-stack images showing brain sections stained using in situ hybridization with gad1b and vglut2.2 probes to visualize different neurochemical clusters of neurons. (A) Control: the gad1b-high Nuc-pc is visible in the dorsal section; gad1b-high lateral and paraventricular clusters in the ventral section; and vglut2.2-positive lateral cluster and vglut2.2-positive region of PcP and cTh are visible in the ventral section. (B) IWR-1: the Nuc-pc is absent, the lateral gad1b-high cluster is smaller, and the vglut2.2-positive area of PcP and cTh is bigger. (C) lef1 crispants: The lateral gad1b-high cluster is smaller, and the vglut2.2-positive area of PcP and cTh is bigger. (D) tcf7l2 crispants: Nuc-pc is smaller and the lateral gad1b-high cluster is smaller. (E) The graphs show volume quantification of distinct clusters indicated in the previous images. Statistics in (E)n = 4–10; one-way ANOVA followed by Dunnett’s post hoc test; *p < 0.05 (the exact p-value is indicated in the graph), **p < 0.01, ***p < 0.001 and ****p < 0.0001. Nuc-pc, nucleus of the posterior commissure; L gad, lateral gad1b-positive cluster; L glut, lateral vglut2.2-positive cluster; Pv gad, periventricular gad1b-positive cluster; CoP, commissural pretectum; JcP, juxtacommissural pretectum; PcP, precommissural pretectum; cTh, caudal thalamus.

Schematic summary of Figures 14. Schemes showing the pattern of marker gene expression and localization of gad1b and vglut2.2-positive areas in the diencephalon of 48 hpf zebrafish. (A,B) Sagittal sections at the medial (A) and lateral (B) levels. (C,D) Transverse section at the dorsal (C) and ventral (D) levels. In the left panel, tcf7l2 expression marks the alar plate of prosomere 1 and 2 and extends into the basal plate; nkx2.2a and lhx9 expression delineate the alar-basal plate boundary in prosomere 1 (CoP, JcP, and PcP) and 2 (Hab, cTh, and rTh); gbx2 and lhx9 expression in the cTh demarcated the rostral border of the Pt; nkx2.2a is also expressed in the rTh, and lhx9 is also expressed in the habenula. In the middle panel, pretectal domains are patterned by the expression of pax6a and pax7a. pax6a is highly expressed in the dorsal subdomain of the Pt. Both pax6a and pax7a markers are present in the central subdomains of the CoP and JcP, but their expression decrease rostrally and ventrally. In the right panel, the expression of gad1b and vglut2.2 identifies several GABAergic and glutamatergic clusters: the Nuc-pc in the caudal edge of the CoP dorsal subdomain, periventricular GABAergic and lateral glutamatergic clusters in the central subdomain of the CoP, lateral GABAergic cluster in the area of the JcP and PcP (lateral parts), and glutamatergic PcP (medial parts). Saturated colors indicate high signal and lighter colors low signal of expression. ap, alar plate; bp, basal plate; Hab, habenula; Mes, mesencephalon; Pt, pretectum; p1, prosomere 1; p2, prosomere 2; p3, prosomere 3; Th, thalamus; cTh, caudal thalamus; rTh, rostral thalamus.

Acknowledgments
This image is the copyrighted work of the attributed author or publisher, and ZFIN has permission only to display this image to its users. Additional permissions should be obtained from the applicable author or publisher of the image. Full text @ Front. Neuroanat.