
- Title
-
Ankk1 Loss of Function Disrupts Dopaminergic Pathways in Zebrafish
- Authors
- Leggieri, A., García-González, J., Torres-Perez, J.V., Havelange, W., Hosseinian, S., Mech, A.M., Keatinge, M., Busch-Nentwich, E.M., Brennan, C.H.
- Source
- Full text @ Front. Neurosci.
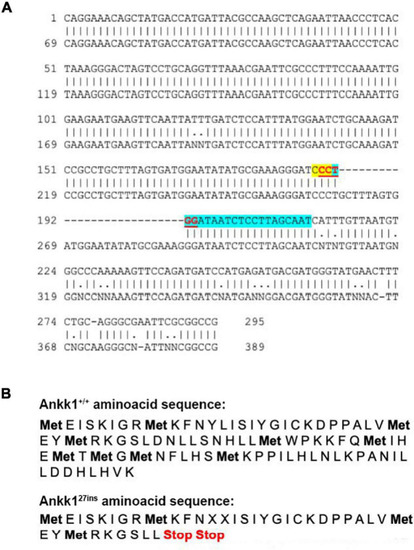
CRISPR-Cas9 generated a 27 bp insertion that disrupts the ankk1 sequence (A) Comparison of wild type (top) and mutant (bottom) ankk1 sequences. crRNA is highlighted in blue. PAM sequence is highlighted in yellow. The restriction site (that is disrupted in the F0 screening) appears in red, underlined. (B) Comparison of wild type (top) and mutant (bottom) amino acid sequences. Mutant sequence generates an early stop codon. |
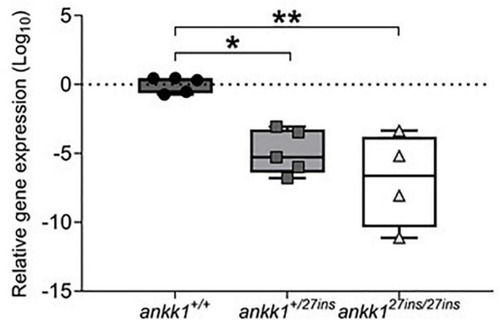
Depletion of mRNA transcripts in 5 days post fertilization zebrafish larvae. ankk1+/+ (dark gray), ankk1+/27ins (gray), and ankk127ins/27ins (white). Data shows box and whiskers (5–95 percentile) and single samples (dots, squares, or triangles). Horizontal lines indicate group mean. Legend: *p ≤ 0.05, **p ≤ 0.01. |
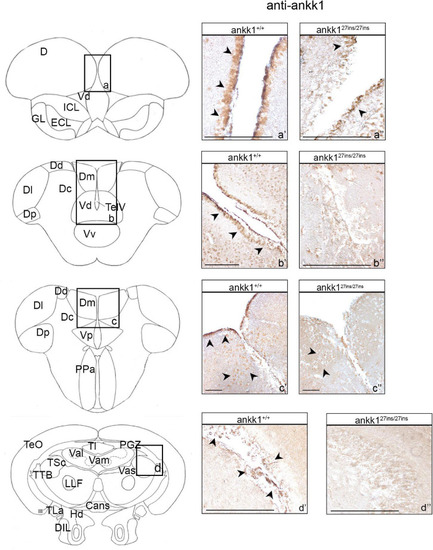
Ankk1 immunohistochemistry in adult zebrafish brain. On the right, ankk1 protein distribution in transverse sections of adult zebrafish brain, ankk1+/+ and ankk127ins/27ins. On the left, schematic depiction of zebrafish brain, transverse section [adapted from Wullimann et al. (1996)]. (a–d) Boxes on the schematic depictions represent the region of the brain showed by the corresponding immunohistochemistry on the right; (a’–c”) forebrain ankk1 staining; (d’,d”); midbrain ankk1 staining. Scale bars: (c’,c”), 50 mm; (b’), 100 mm; (a’,a”,b”,d’,d”), 200 mm. Arrows indicate anti-ankk1 positive cells. |
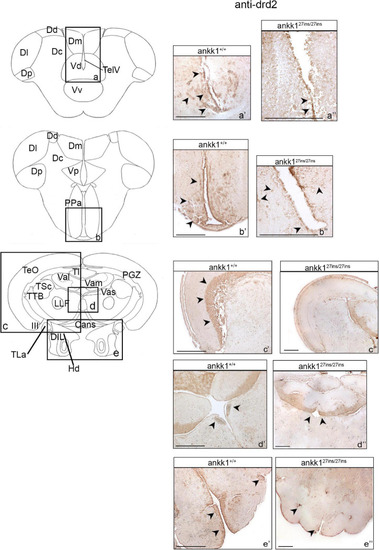
Drd2 immunohistochemistry in adult zebrafish brain. On the right, drd2 protein distribution in transverse sections of zebrafish brain, ankk1+/+ and ankk127ins/27ins. On the left, schematic depiction of zebrafish brain, transversal section [adapted from Wullimann et al. (1996)]. (a–e) Boxes on the schematic depictions represent the region of the brain showed by the corresponding immunohistochemistry on the right; (a’–b”) forebrain drd2 staining; (c’–e”) midbrain drd2 staining. Scale bars: (c”,d”,e’), 50 mm; (a’–e’), 100 mm; (b”), 200 mm. Arrows indicate anti-drd2 positive cells. EXPRESSION / LABELING:
PHENOTYPE:
|
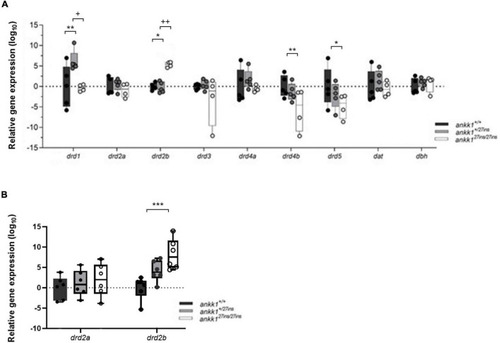
Quantification of dopaminergic gene expression. (A) Expression levels of drd2a, drd2b, drd1, drd3, drd4a, drd4b, drd5, dat, and dbh in 5 days post fertilization zebrafish larvae (ankk1+/+, ankk1+/27ins, and ankk127ins/27ins) measured by qPCR. Each dot represents a pool of larvae (ntotal = 80 larvae: 5 samples consisting of 16 larvae for ankk1+/+ and ankk1+/27ins, and 4 samples consisting of 16 larvae for each sample (ankk127ins/27ins). (B) Expression levels of drd2a and drd2b in adult zebrafish whole brains. Each dot represents a single brain. Data are shown in box-whiskers plot (5–95 percentile). Legend: *p < 0.05 versus ankk1+/+; **p < 0.01 versus ankk1+/+; ***p < 0.0001 versus ankk1+/+; +p < 0.05 versus corresponding ankk1+/27ins; ++p < 0.01 versus corresponding ankk1+/27ins. Statistics for gene expression data and P value adjustment are provided in Supplementary Tables 2, 3. |
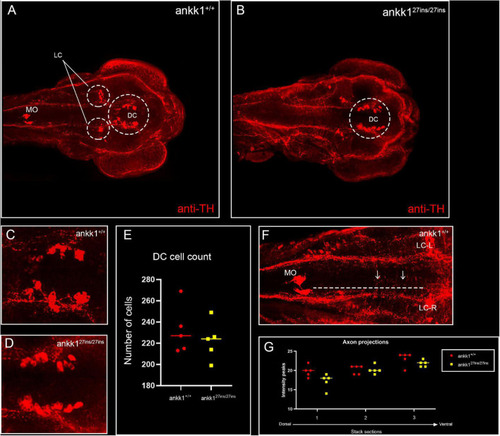
Anti-tyrosine hydroxylase (TH) immunolabeling on 3 days post fertilization zebrafish larvae. (A,C) ankk1+/+ and (B,D) ankk127ins/27ins. (A,B) Maximum projection dorsal view of whole mount larvae. Circles indicate diencephalic dopaminergic cluster (DC), used for quantification of cell number (E), and locus coeruleus (LC) used as landmark for determining the extent of the medial longitudinal catecholaminergic tract when quantifying the number of anti-TH labeled projections to the midline (F,G). (C,D) Representative images of staining of DC used for cell quantification shown in (E). (F) Example of sections used for quantification of dopaminergic projections shown in (G). Projections were assessed from posterior to anterior using the LC and anterior extent of the medulla oblongata (MO) as landmarks [(F) dotted line, arrows indicate example of projections], and from dorsal to ventral [(G) stacks 1–3]. N = 5 samples × genotype group. EXPRESSION / LABELING:
PHENOTYPE:
|
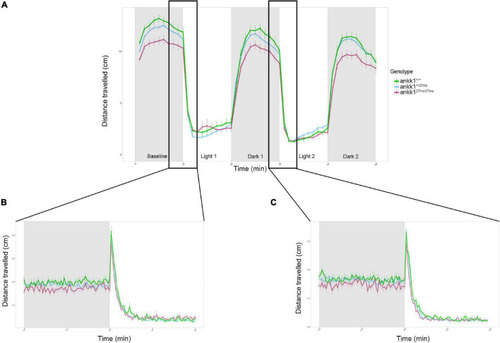
Forced light/dark test in 5 days post fertilization zebrafish larvae (ankk1+/+, ankk1+/27ins, ankk127ins/27ins). (A) The assay consisted of 10 s of basal tracking, followed by two light/dark cycles of 10 min each. Dots represent mean distance traveled per minute. Error bars show standard error of the mean. (B,C) One-second time bins resolution plots of the dark/light transitions. PHENOTYPE:
|
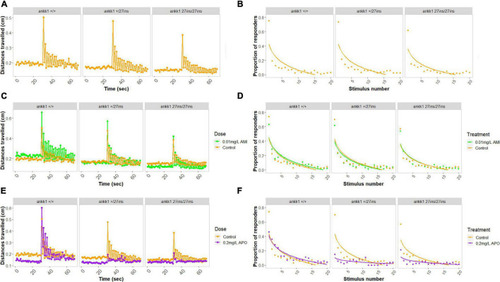
Habituation to acoustic startle response in 5 days post fertilization larvae (ankk1+/+, ankk1+/27ins, and ankk127ins/27ins) in presence (0.01 mg/L) or absence (control) of amisulpride. The assay consisted of 60 s of basal tracking, followed by 20 acoustic stimuli within 2 s intervals. (A,C,E) Mean distances traveled by ankk1+/+, ankk1+/27ins, ankk127ins/27ins. Sample size: N = 145 per genotype. (B,D,F) Proportion of individuals responding to each startle stimulus. N = 226 ankk1+/+control, N = ankk1+/27inscontrol, N = 226 ankk127ins/27ins control, N = 226 ankk1+/+AMI, N = 145 ankk1+/27ins AMI, N = 145 ankk127ins/27ins AMI, N = 145 ankk1+/+APO, N = 145 ankk1+/27ins APO, N = 145 ankk127ins/27ins APO. Error bars show standard error of the mean. PHENOTYPE:
|