
- Title
-
An atlas of neural crest lineages along the posterior developing zebrafish at single-cell resolution
- Authors
- Howard, A.G., Baker, P.A., Ibarra-García-Padilla, R., Moore, J.A., Rivas, L.J., Tallman, J.J., Singleton, E.W., Westheimer, J.L., Corteguera, J.A., Uribe, R.A.
- Source
- Full text @ Elife
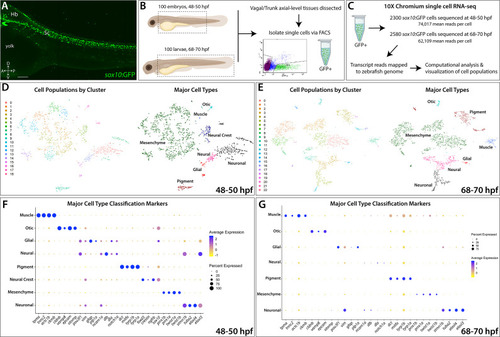
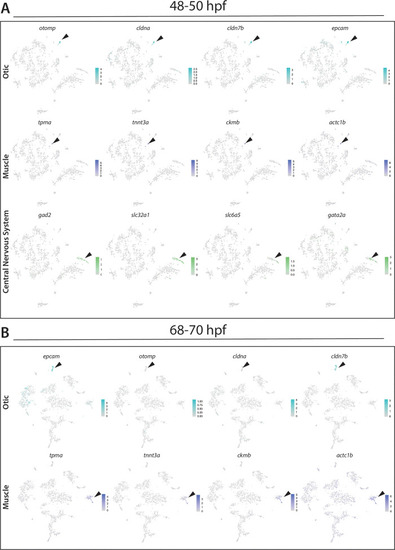
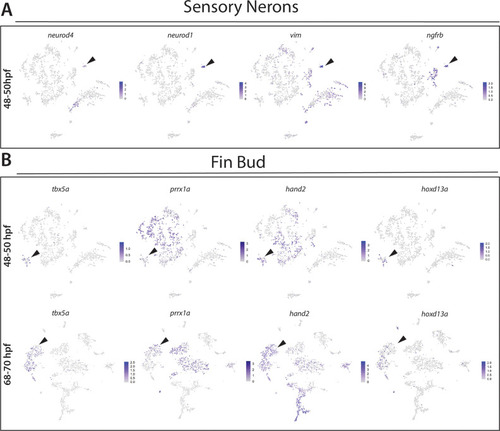
(A) Confocal image of a sox10:GFP+ embryo at 48 hpf; Hb: Hindbrain; Sc: Spinal cord. A: Anterior, P: Posterior, D: Dorsal, V: Ventral. Scale bar: 50 μM (B) Cartoon illustrations of a zebrafish embryo at 48–50 hpf and an early larval fish at 68–70 hpf depicted laterally to summarize the dissection workflow used to collect posterior sox10:GFP+ cells. (C) Schematic of the 10X Genomics Chromium and data analysis pipeline. (D) tSNE plots showing the arrangement of Clusters 0–18 and where the major cell types identified among sox10:GFP+ cells arrange in the 48–50 hpf dataset. (E) tSNE plots showing the arrangement of Clusters 0–22 and where the major cell types identified among sox10:GFP+ cells arrange in the 68–70 hpf dataset. (F,G) Dot plots of the identifying gene markers for each major cell type classification in the 48–50 hpf and 68–70 hpf datasets, respectively. Dot size depicts the cell percentage for each marker within the dataset and the color summarizes the average expression levels for each gene. |
( |
( |
( |
( |
( |

( |
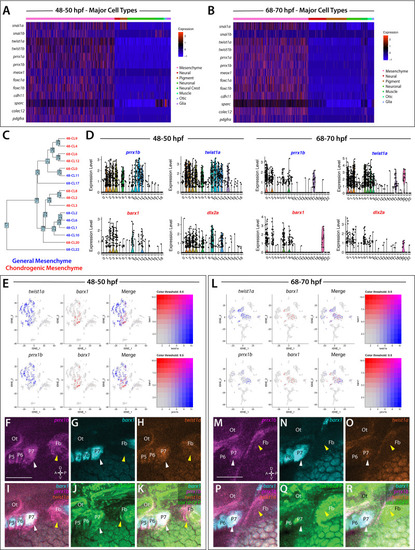
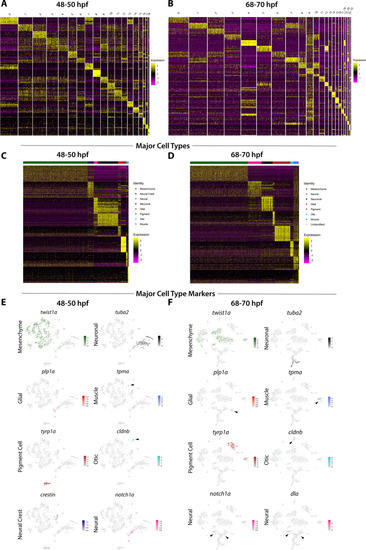
(A,B) A heatmap of signature mesenchyme identity genes within the major cell type classified cells at 48–50 and 68–70 hpf, respectively. Relative expression levels within each cluster is summarized within the color key, where red to blue color indicates high to low gene expression levels. (C) A cluster tree depicting the relationship between general and chondrogenic mesenchyme cellular subtypes. (D) Violin plots summarizing the expression levels for select mesenchyme identity markers within individual clusters at the 48–50 and 68–70 hpf time points, respectively. Data points depicted in each cluster represent single cells expressing each gene shown. (E,L) tSNE plots depicting the co-expression of twist1a (blue) and barx1 (red) or prrx1b (blue) and barx1 (red) in the 48–50 and 68–70 hpf datasets, respectively. Relative expression levels are summarized within the color keys, where color intensity is proportional to expression level of each gene depicted. (F–K) Whole mount HCR analysis reveals the spatiotemporal expression of prrx1b (F), barx1 (G), twist1a (H), sox10:GFP (J) in 48 hpf embryos. (I) A merge of barx1, prrx1b, and twist1a is shown. (K) A merge of barx1, prrx1b, twist1a, and sox10:GFP is shown. White arrowheads denote expression in posterior pharyngeal arch, while yellow arrowheads highlight fin bud expression. (M–R) Whole mount HCR analysis reveals the spatiotemporal expression of prrx1b (M), barx1 (N), twist1a (O), sox10:GFP (Q) in 68 hpf embryos. (P) A merge of barx1, prrx1b, and twist1a is shown. (R) A merge of barx1, prrx1b, twist1a, and sox10:GFP is shown. White arrowheads denote expression in posterior pharyngeal arch, while yellow arrowheads highlight fin bud expression. Ot: otic; Fb: Fin bud. Scale bar: 100 µm. |

( |
( |

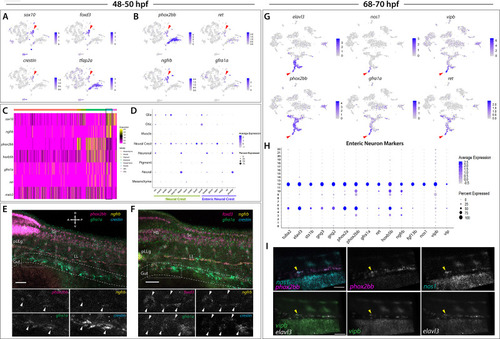
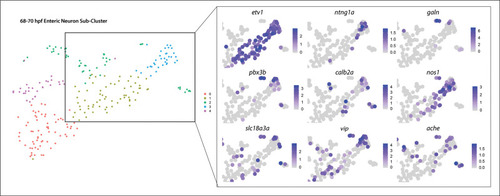
(A) tSNE plot reveals five distinct sub-clusters following the subset analysis and re-clustering of Clusters 5 and 12 from the 68–70 hpf data set. (B) Dot plot depicts expression levels of enteric neuron markers across resulting Sub-clusters. Each marker was expressed at low levels in Sub-cluster 1 and were found to be expressed at higher levels within Sub-cluster 3. (C) tSNE feature plots further depict the expression of enteric neuron markers by illustrating the levels and localization of expression within the Sub-cluster architecture. Feature plots supplement dot plot and demonstrate the prominent expression of enteric neuron markers within Sub-cluster 3, which appears to emanate from Sub-cluster 1. (D,E) Violin and feature plots reveal expression levels of acetylcholine-associated and excitatory neuron markers reported to distinguish enteric IPANs. These markers were found in a discrete pocket of cells forming the distal-most region of Sub-cluster 3 (red arrowhead). Violin data points depicted in each Sub-cluster represent single cells expressing each gene shown. (F) Graphical model summarizes expression patterns observed in 68–70 hpf data set and HCR validation. Common enteric neuroblast capable of diverging into subsequent lineages, IPAN, inhibitory neuron, and interneuron through lineage restricted gene expression. pbx3b promotes assumption of IPAN role through loss of nos1 and vipb and begins expressing calb2a, ache, and slc18a3a. (G) Whole mount HCR analysis reveals co-expression of IPAN marker genes, pbx3b and calb2a, and inhibitory neurochemical marker genes, vipb and nos1 (white arrowheads), within the foregut (dashed white line) at 68 hpf. Vesicular acetylcholine transferase, slc18a3a, was not observed in tandem with pbx3b but was co-expressed with calb2a, vipb, and nos1 (yellow arrowheads). Scale bar: 50 μM. (H) Feature plots reveal expression of opioid receptor genes, oprl1 and oprd1b, within the differentiated enteric neuron Sub-cluster 3. (I–N) Whole mount HCR analysis validates expression of oprl1 in combination with vipb and phox2bb (yellow arrowheads) in enteric neurons localized to the foregut region of a 68 hpf embryo. Scale bar: 10 μM. |
Subtype diversification and IPAN emergence depicted via combinatorial gene expression ( |
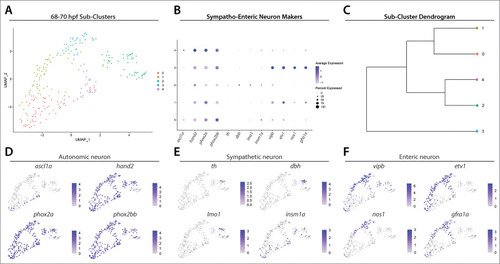
UMAP analysis of Sub-clusters depicts enteric and sympathetic neurons delineating from a common pool of autonomic neurons. (A) UMAP plot generated following re-clustering of Clusters 5 and 12 from the 68–70 hpf data set. (B) Dot plot depicts expression levels of general autonomic neuron makers (ascl1a, hand2, phox2a, phox2bb), sympathetic neuron markers (th, dbh, lmo1, insm1a) and enteric neuron markers (vipb, etv1, nos1, gfra1a) within Sub-clusters 0–4. (C) Dendrogram denotes similarity of Sub-clusters based on average gene expression of each cell within the Sub-clusters, which reveals transcriptomic distinction of enteric neuron Sub-cluster 3. (D–F). Feature plots highlight the expression of autonomic, sympathetic, and enteric neuron gene markers within UMAP Sub-clusters. |
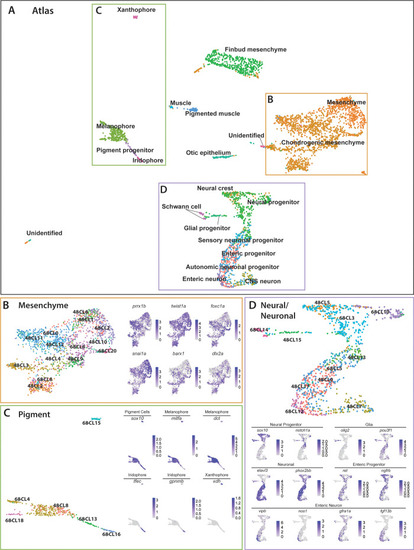
(A) Global UMAP embedding demonstrating the clustering of cell types across 48–50 hpf and 68–70 hpf. Cell labels were transferred from the original curation (Figure 1—source data 2) to the new atlas after its creation, allowing for assessment of cell type organization. (B) Previously identified mesenchyme clusters form a large discernible cluster marked by prrx1b, twist1a, foxc1a, and snai1a, which was separated into both chondrogenic and general mesenchyme, as denoted by its differential expression of barx1 and dlx2a. Importantly, nearly every 48–50 hpf cell type nests with a cluster at 68–70 hpf. (C) Pigment cells clusters reflect differentiation paths described in Figure 4A. Melanophores at 48–50 hpf group near to the 68–70 hpf melanophore cluster, bipotent pigment progenitors bridges both the iridophores and melanophores. Xanthophores cluster separately, reflecting their distinct lineage of origin at this developmental window. (D) Detailed analysis of the larger neural/neuronal cluster shows clear progression of cell fates from progenitor to differentiating glia or neuron. The expression of enteric neuronal markers is distinct from other subtypes at this dataset. |
( |
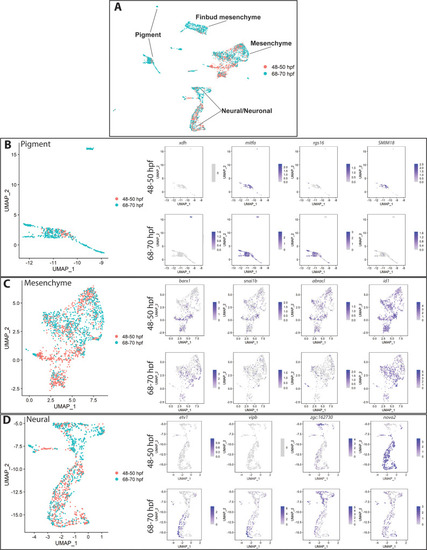
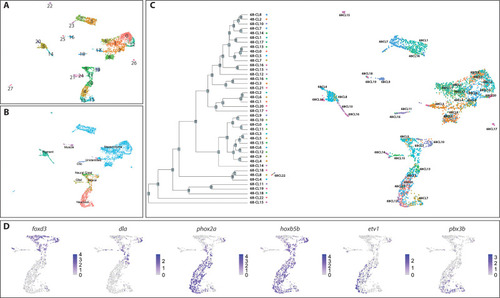
All 48–50 hpf cells (pink) approximately map to a major cluster found at 68–70 hpf (aqua). ( |

(A) Dot plot shows both the mean expression (color) as well as percent of cells (size) per lineage for zebrafish hox genes in the first eight paralogy groups (PG). The full list of hox gene expression profiles per lineage can be found in Figure 7—figure supplement 1. Discrete hox profiles discern specific cell types, which is particularly evident in the enteric neuronal cluster. (B) Clustering of atlas lineages based hox expression profiles groups highlights robust core neural signature, which distinguishes the neural lineages from the remainder of the clades. Neural and glial progenitors formed an intermediate clade between the low-hox expressing lineages and the main neural branch. Additionally, the fin bud mesenchyme, which also has a highly distinctive hox profile, also forms a distinct clade. Subtle variations in hox expression by remaining lineages are further reflected in the remaining portion of the dendrogram; however, these are far less distinct. (C–D) Pairwise comparison of the fraction of cells in either the autonomic neural progenitor lineage (C) or the enteric neurons (D) for the first eight parology groups. Intersection of the gene pairs reflect the fraction of cells with expression for both genes with a log2 Fold change values > 0, with the identical gene intersections along the primary diagonal representing the total number of cells which express that gene in the lineage. Enteric neural hox signature was not only specific to this cell population, but also was abundantly co-expressed. (E) Summary panel describing the specific autonomic and enteric hox signatures detected. A common hox expression profile, referred to as the core signature, was found that is then modified across the specific lineages. (F–M) In situ validation of the chief enteric neural hox signature via HCR. phox2bb (F–J) labels enterically fated neurons at the level of the midgut in larval stage embryos fixed at 70–72hpf. White arrows highlight specific cells of interest. Key hox signature constituents hoxb5a (G) and hoxb5b (H) or hoxd4a (K) and hoxa5a (L) were found to be co-expressed within phox2bb expressing cells (White Arrows). Scale bars in (I,M): 50 μm. |
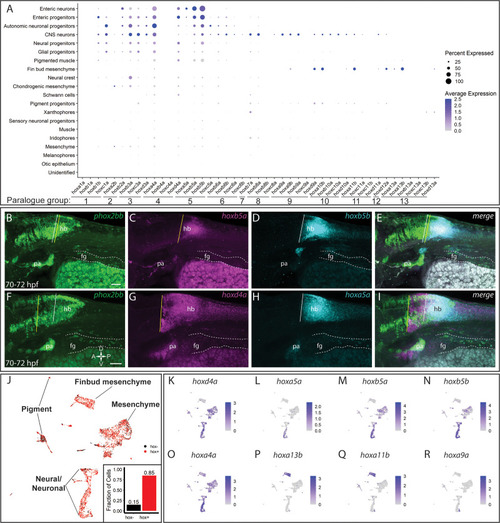
(A) Similar to Figure 7A,a comprehensive dot plot shows both the mean expression (color) as well as percent of cells per lineage (size) for zebrafish all hox genes. Discrete hox profiles discern specific cell types, which is particularly evident in the enteric neuronal cluster, as well as the fin bud mesenchyme. (B–I) Hindbrain expression patterns for enteric hox profiles. Autonomic neural marker phox2bb clearly marks the midbrain and hindbrain (hb) domains, as well as the pharyngeal arches (pa). Enterically fated cells can also clearly be seen along the tract of the gut (dash region), starting the foregut (fg). Anterior domains for hoxb5a (C), hoxb5b (D), hoxd4a (G), and hoxa5a (H) are represented by a vertical line. Overlapping regions can be approximated by the merged images (E, I). Scale in (B, F): 50 μm; dorsoventral-rostrocaudal axis defined in (F). (J) UMAP of the atlas demonstrating pervasive hox expression throughout the dataset. Expression was defined as having a log2 fold change >0. Approximately 85% of cells contained expression for at least one hox gene. (K–R) Feature plots representing the expression of selected hox genes within the atlas UMAP. hoxd4a (K), hoxa5a (L), hoxb5a (M), hoxb5b (N) all localize in varying degrees to the enteric neural signature, though hoxd4a also marks the mesenchymal clusters, as seen (A). hoxa4a (O) highlights its pervasive expression among the clusters. hoxa13b (P) and hoxa11b (Q) are key markers denoting the fin bud mesenchyme. Alternative neural populations are further identified by their hoxa9a (R) expression profile, contrasting with the enteric populations. |