
Figure 5 - figure supplement 2
- ID
- ZDB-FIG-210220-19
- Publication
- Howard et al., 2021 - An atlas of neural crest lineages along the posterior developing zebrafish at single-cell resolution
- Other Figures
-
- Figure 1
- Figure 1 - figure supplement 1
- Figure 1 - figure supplement 2
- Figure 1 - figure supplement 3
- Figure 1 - figure supplement 4
- Figure 1 - figure supplement 5
- Figure 2
- Figure 3
- Figure 3 - figure supplement 1
- Figure 4
- Figure 5
- Figure 5 - figure supplement 1
- Figure 5 - figure supplement 2
- Figure 6
- Figure 6 - figure supplement 1
- Figure 6 - figure supplement 2
- Figure 7
- Figure 7 - figure supplement 1
- All Figure Page
- Back to All Figure Page
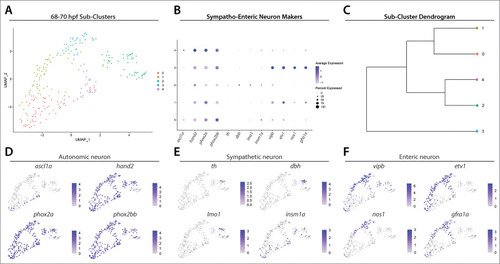
UMAP analysis of Sub-clusters depicts enteric and sympathetic neurons delineating from a common pool of autonomic neurons. (A) UMAP plot generated following re-clustering of Clusters 5 and 12 from the 68–70 hpf data set. (B) Dot plot depicts expression levels of general autonomic neuron makers (ascl1a, hand2, phox2a, phox2bb), sympathetic neuron markers (th, dbh, lmo1, insm1a) and enteric neuron markers (vipb, etv1, nos1, gfra1a) within Sub-clusters 0–4. (C) Dendrogram denotes similarity of Sub-clusters based on average gene expression of each cell within the Sub-clusters, which reveals transcriptomic distinction of enteric neuron Sub-cluster 3. (D–F). Feature plots highlight the expression of autonomic, sympathetic, and enteric neuron gene markers within UMAP Sub-clusters. |