
|
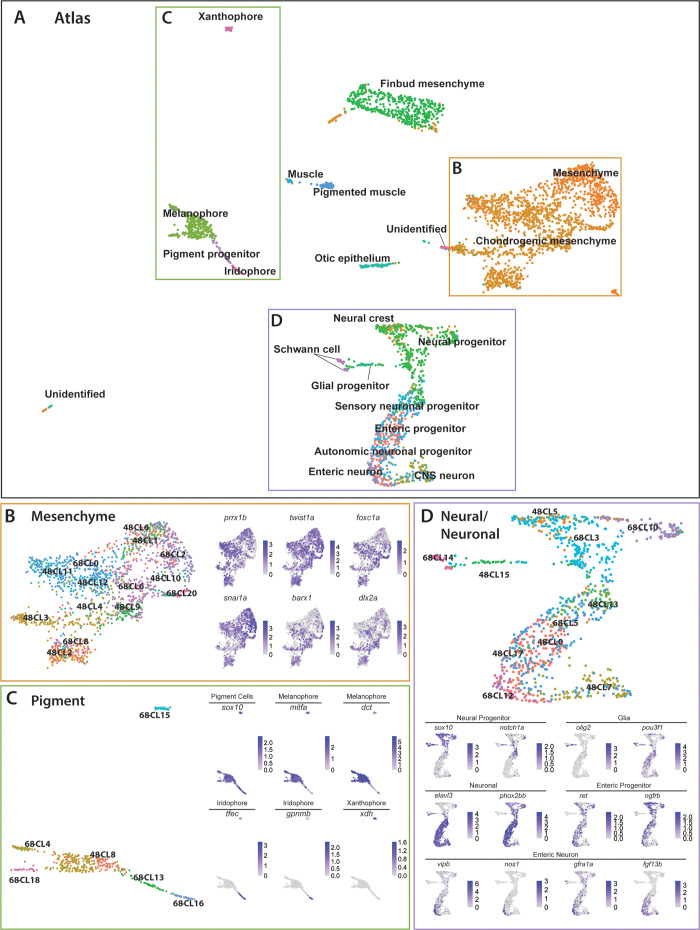
Figure 6 (A) Global UMAP embedding demonstrating the clustering of cell types across 48–50 hpf and 68–70 hpf. Cell labels were transferred from the original curation (Figure 1—source data 2) to the new atlas after its creation, allowing for assessment of cell type organization. (B) Previously identified mesenchyme clusters form a large discernible cluster marked by prrx1b, twist1a, foxc1a, and snai1a, which was separated into both chondrogenic and general mesenchyme, as denoted by its differential expression of barx1 and dlx2a. Importantly, nearly every 48–50 hpf cell type nests with a cluster at 68–70 hpf. (C) Pigment cells clusters reflect differentiation paths described in Figure 4A. Melanophores at 48–50 hpf group near to the 68–70 hpf melanophore cluster, bipotent pigment progenitors bridges both the iridophores and melanophores. Xanthophores cluster separately, reflecting their distinct lineage of origin at this developmental window. (D) Detailed analysis of the larger neural/neuronal cluster shows clear progression of cell fates from progenitor to differentiating glia or neuron. The expression of enteric neuronal markers is distinct from other subtypes at this dataset.