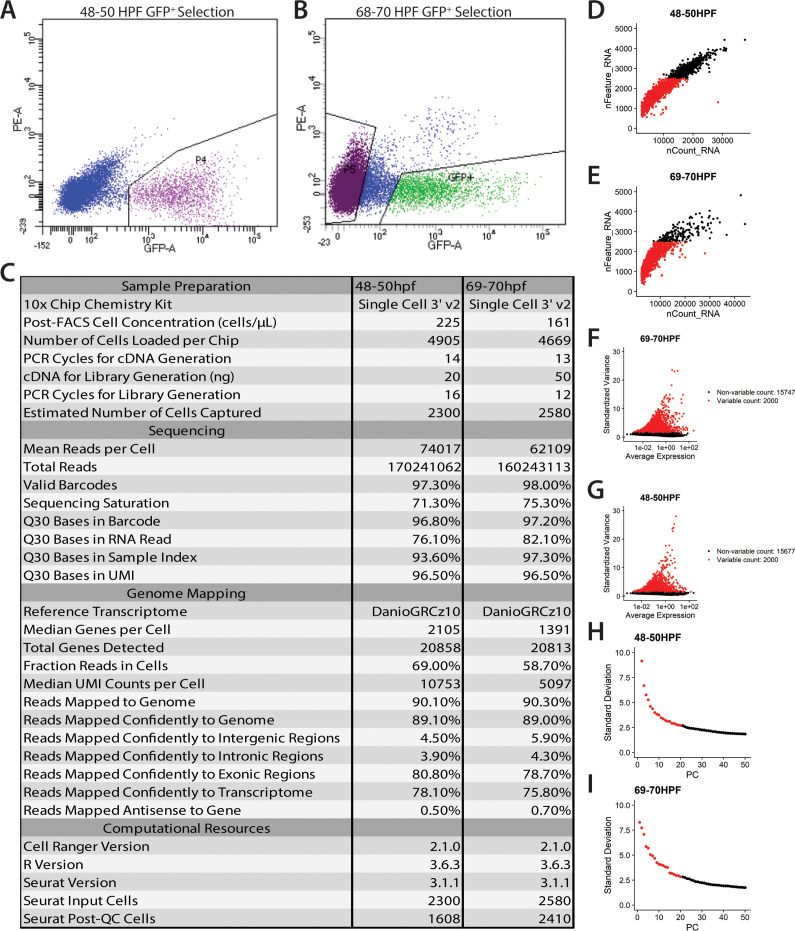
Image
Figure Caption

Figure 1—figure supplement 1. Statistics on generation and filtering of single cell transcriptomes at 48–50 hpf and 68–70 hpf.

(A,B) Fluorescence activated cell sorting plots highlighting the GFP+ cell population sorted at 48–50 hpf (A) and 68–70 hpf (B). (C) Table of general statistics pertaining to the sequencing and alignment of reads from the Cell Ranger pipeline. Additional metrics provided were derived from the Seurat R package as described in the Materials and Methods section. (D,E) Plots showing the feature selection for both the 48–50 hpf (D) and 68–70 hpf (E) datasets. Cells were selected such that they had fewer than 2500 features to reduce spuriously sorted cells. (F,G) Top 2000 most variably expressed genes were identified and used for further downstream identification of significant principal components, as described in the Materials and Methods section. (H,I) Most significant principal components (top 20 for both datasets) were selected to be used for subsequent cluster identification and cell embedding in tSNE and UMAP spaces.

Acknowledgments
This image is the copyrighted work of the attributed author or publisher, and ZFIN has permission only to display this image to its users. Additional permissions should be obtained from the applicable author or publisher of the image. Full text @ Elife