
|
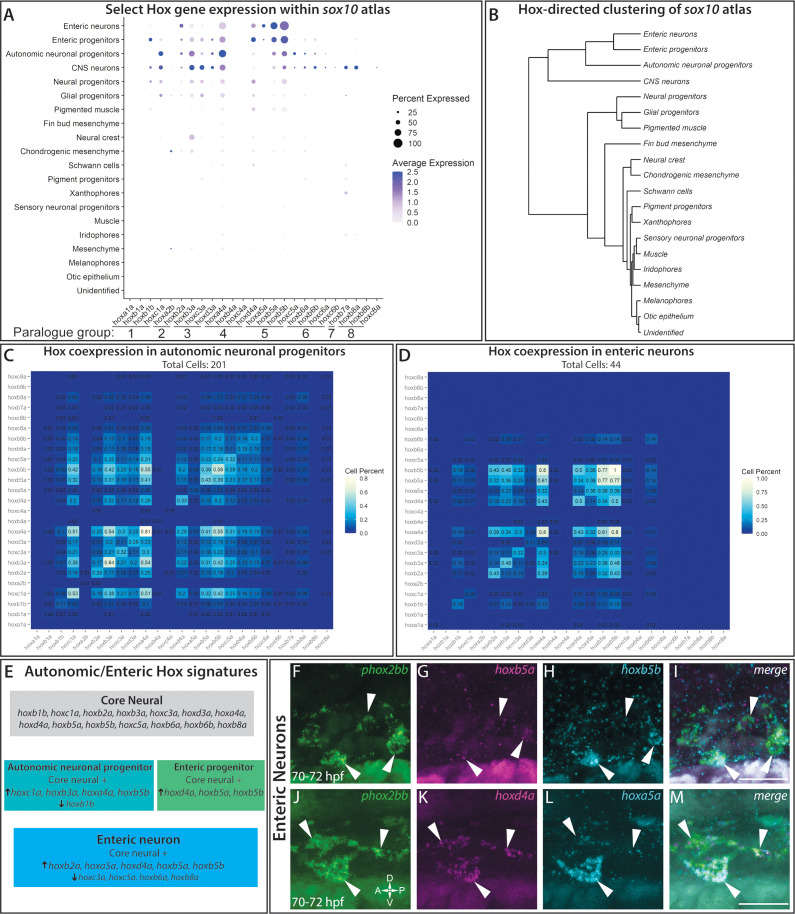
Figure 7 (A) Dot plot shows both the mean expression (color) as well as percent of cells (size) per lineage for zebrafish hox genes in the first eight paralogy groups (PG). The full list of hox gene expression profiles per lineage can be found in Figure 7—figure supplement 1. Discrete hox profiles discern specific cell types, which is particularly evident in the enteric neuronal cluster. (B) Clustering of atlas lineages based hox expression profiles groups highlights robust core neural signature, which distinguishes the neural lineages from the remainder of the clades. Neural and glial progenitors formed an intermediate clade between the low-hox expressing lineages and the main neural branch. Additionally, the fin bud mesenchyme, which also has a highly distinctive hox profile, also forms a distinct clade. Subtle variations in hox expression by remaining lineages are further reflected in the remaining portion of the dendrogram; however, these are far less distinct. (C–D) Pairwise comparison of the fraction of cells in either the autonomic neural progenitor lineage (C) or the enteric neurons (D) for the first eight parology groups. Intersection of the gene pairs reflect the fraction of cells with expression for both genes with a log2 Fold change values > 0, with the identical gene intersections along the primary diagonal representing the total number of cells which express that gene in the lineage. Enteric neural hox signature was not only specific to this cell population, but also was abundantly co-expressed. (E) Summary panel describing the specific autonomic and enteric hox signatures detected. A common hox expression profile, referred to as the core signature, was found that is then modified across the specific lineages. (F–M) In situ validation of the chief enteric neural hox signature via HCR. phox2bb (F–J) labels enterically fated neurons at the level of the midgut in larval stage embryos fixed at 70–72hpf. White arrows highlight specific cells of interest. Key hox signature constituents hoxb5a (G) and hoxb5b (H) or hoxd4a (K) and hoxa5a (L) were found to be co-expressed within phox2bb expressing cells (White Arrows). Scale bars in (I,M): 50 μm.