|
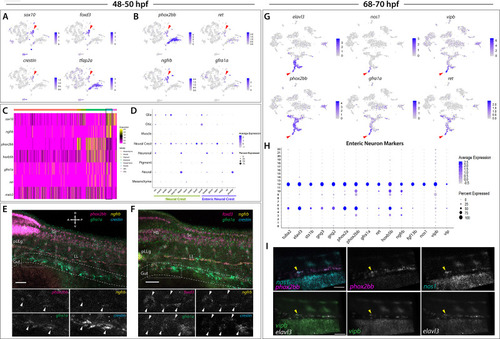
Enteric neural crest cells and differentiating enteric neurons are present among posterior <italic>sox10</italic>:GFP<sup>+</sup> cell populations.(A) tSNE feature plots reveal expression of core neural crest cell markers sox10, foxd3, crestin, and tfap2a mapping to the neural crest cell cluster (red arrowhead). (B) tSNE feature plots depict expression of the enteric neural crest cell markers phox2bb, ret, ngfrb and gfra1a within the neural crest cell cluster (red arrowhead). Relative expression levels are summarized within the color keys in (A) and (B), where color intensity is proportional to expression level of each gene depicted. (C) A heatmap reveals expression levels of enteric neural crest cell markers across the eight major cell populations captured in the 48–50 hpf data set (color key denotes cells types represented in color bar on top of heatmap). Neural crest cell cluster highlighted in black rectangle. Relative expression levels within each major cell type cluster is summarized within the color key, where yellow to magenta color indicates high to low gene expression levels. (D) Dot plot of expanded list of neural crest (green line) and enteric neural crest (purple line) cell markers across each major cell type within 48–50 hpf data set. Dot size depicts the cell percentage for each marker within the data set and the color summarizes the average expression levels for each gene. (E,F) Whole mount HCR analysis of 48 hpf embryos reveals co-expression of the enteric neural crest cell markers phox2bb, ngfrb, gfra1a, and crestin in (E), or foxd3, ngfrb, gfra1a and crestin in (F), within the developing gut (dashed outline). Top panels depict merged images of color channels for each HCR probe. Lower panels represent gray-scale images of each separated channel corresponding to the magnified region of foregut (gray rectangle). Arrowheads depict regions where all markers are found to be co-expressed. Hb: Hindbrain, Sc: Spinal cord, pLLg: posterior Lateral Line ganglia, LL: Lateral Line. A: Anterior, P: Posterior, D: Dorsal, V: Ventral. Scale bar: 50 μM. (G) tSNE feature plots reveal expression levels of enteric neuron markers elavl3, phox2bb, gfra1a, nos1, vipb, and ret, within a common region of a neuronal cluster (red arrowhead). Relative expression levels are summarized within the color keys, where color intensity is proportional to expression level of each gene depicted. (H) Dot plot depicts expression levels of pan-neuronal and enteric neuron specific markers across individual clusters generated within the original 68–70 hpf tSNE. Pan-neuronal markers found throughout Clusters 5 and 12, with enteric neuron markers most prominently expressed within Cluster 12. Dot size depicts the cell percentage for each marker within the data set and the color summarizes the average expression levels for each gene. (I) Whole mount HCR analysis depicts differentiating enteric neurons within the foregut region at 69 hpf co-expressing nos1, phox2bb, vipb, and elavl3 (yellow arrowheads). Anterior: Left, Posterior: Right. Scale bar: 50 μM.
|