
- Title
-
Zebrafish heart regenerates after chemoptogenetic cardiomyocyte depletion
- Authors
- Missinato, M.A., Zuppo, D.A., Watkins, S.C., Bruchez, M.P., Tsang, M.
- Source
- Full text @ Dev. Dyn.
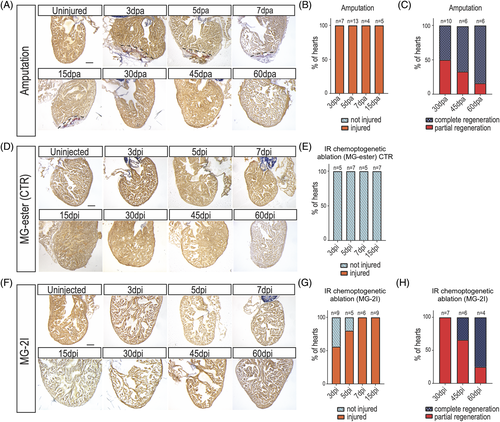
Zebrafish regenerate after cardiomyocyte chemoptogenetic ablation. A, AFOG staining in WT adult zebrafish hearts before and after ventricular apex amputation. (dpa) = days post amputation. Black dashed lines delineate injured area. B, Graph representing the percentage of hearts that were injured (orange) at multiple time points. Percentages were calculated upon sectioning and AFOG staining. 100% of the hearts undergoing amputation were injured, showing the efficiency of the surgery. C, Graph reporting the percentage of hearts that were completely (blue) or partially (red) regenerated at 30-, 45-, and 60 dpa. At 30 dpa, 50% of the fish were completely regenerated, while at 60 dpa almost all the fish showed complete regeneration. D, AFOG staining of Tg(myl7:fapdl5-cerulean) hearts after injection of control MG-ester and IR light treatment at several time points. (dpi) = days post injection. Hearts appeared normal at every time point studied. Damage was determined as fraction of myocyte area of the total ventricular area. E, Graph showing that upon injection of control MG-ester and IR light treatment. F, AFOG staining of Tg(myl7:fapdl5-cerulean) hearts after injection of MG-2I and IR light treatment at several time points. Visible loss of cardiomyocytes was detected as early as 3 dpi. G, Graph representing the percentage of hearts that were injured (orange) or not injured (light blue) at several time points after MG-2I injection. At 3 dpi only 50% of the hearts showed injury, but by 7 dpi, all the hearts showed injury. H, Graph representing the percentage of hearts that show complete or partial regeneration at later time points. Total number of hearts analyzed are indicated. Scale bars = 100 μm |
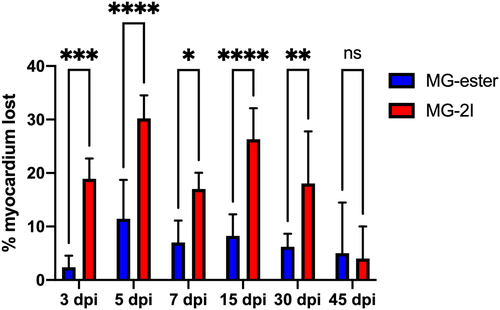
Chemoptogenetic damage causes loss of myocardium after MG-2I treatment. Regions of Interest were taken from WT uninjured, Tg(myl7:fapdl1-cerulean) MG-ester-, and Tg(myl7:fapdl1-cerulean) MG-2I-treated hearts after AFOG staining and intact myocardium was measured using Threshold Particle Analysis (Image J). Myocardial area from MG-ester and MG-2I hearts was normalized to WT uninjured hearts to generate the amount of tissue lost as a percentage. MG-2I-treated hearts showed significant loss of myocardium at 3 dpi and 5 dpi (compared to MG-ester controls), and also regenerated this damage by 45-60dpi. A minimum of three hearts were used per condition with the following as the total n values: WT uninjured (n = 6), MG-ester (3 dpi (n = 5), −5 dpi (n = 5), −7 dpi (n = 5), −15 dpi (n = 5), −30 dpi (n = 5), −45 dpi (n = 3)), and MG-2I (3 dpi (n = 5), −5 dpi (n = 5), −7 dpi (n = 6), −15 dpi (n = 6), −30 dpi (n = 5), −45 dpi (n = 3)). *P < .05; **P < .01; ***P < .001; ****P < .0001; Two-way ANOVA using Šidák's multiple comparisons test. Values without asterisks are not statistically different from MG-ester control samples |
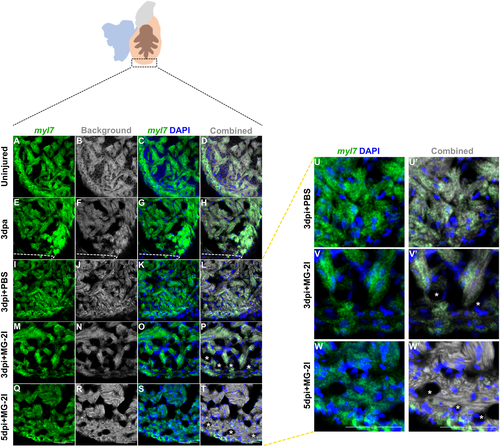
Myocardium integrity was reduced after MG-2I treatment. Fluorescent in situ hybridization was used to assess the integrity of the myocardium after different types of injury. A representative image of uninjured heart (A–D; n = 5), 3 dpa (E–H; n = 3), control PBS treated Tg(myl7:fapdl1-cerulean) at 3 dpi (I–L and U, U′; n = 4), MG-2I treated Tg(myl7:fapdl1-cerulean) at 3 dpi (M–P and V, V′; n = 3) and 5 dpi (Q–T and W, W′; n = 4) are shown. Uniform distribution of myl7 were noted in uninjured and PBS control treated hearts at 3 dpi (A–D and E–H). Absence of myl7 were detected in 3 dpi (M–P, V) and 5 dpi (Q–T, W) hearts treated with MG-2I and infrared light that indicated loss of trabeculated myocardium and damage to the compact myocardium as marked by asterisks. Scale bar = 50 μm |
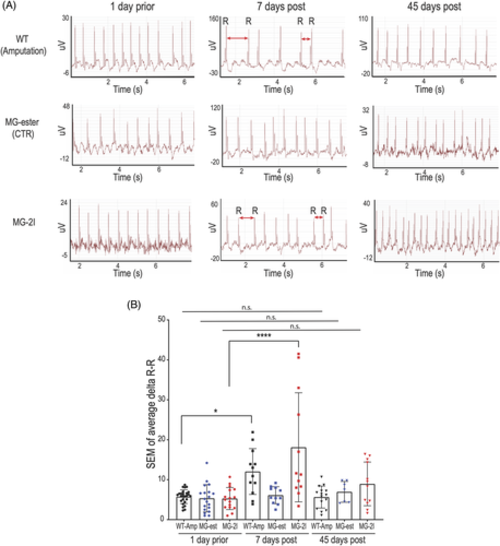
Chemoptogenetic cardiomyocyte ablation causes arrhythmia. A, Representative electrocardiograms (ECG) of adult zebrafish before and after amputation or ablation. One day prior amputation or ablation (left panels), hearts showed normal heart beat rhythm without arrhythmic events. Seven days post amputation or MG-2I injection and IR light treatment, several zebrafish showed arrhythmic events (central panels) Red double heads arrows indicate longer or shorter R-R intervals. Importantly, injection and irradiation of control MG-ester did not cause arrhythmia (central panels). Forty-five days post injury (right panels), ECG were comparable to uninjured hearts, suggesting that all the hearts have recovered. B, Graph quantifying the ECG. At least n = 7 for each group. *P < .05; ****P < .0001; one-way ANOVA. Each ECG trace revealed at least 250 heartbeats |
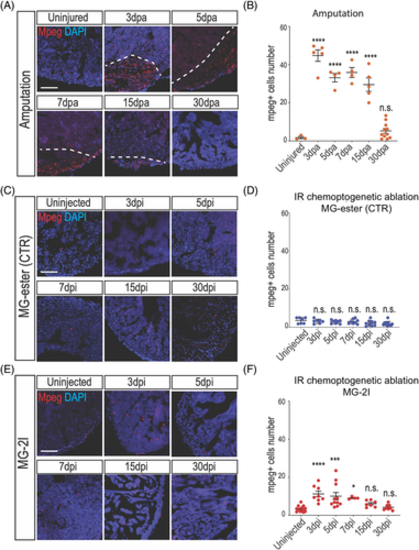
Macrophages are activated after cardiomyocyte chemoptogenetic ablation. A, Mpeg and DAPI staining before and at multiple time points after ventricular apex resection. White dashed lines indicate injury area. B, Quantification of mpeg+ cells inside the injury after amputation. Between 3- and 15 dpa, macrophages were detected inside the injured area. By 30 dpa, the number of macrophages were similar to the uninjured hearts. At least n = 3 for each group. ****P < .0001 One-way ANOVA. C, Mpeg and DAPI staining in Tg(myl7:fapdl5-cerulean) hearts before and after injection of control MG-ester and near IR light exposure. D, Quantification of Mpeg positive cells in the ventricle. No differences were noted at different time points after MG-ester injection. E, Mpeg and DAPI staining before and after cardiac chemoptogenetic ablation. F, Graph with the number of Mpeg+ cells per ventricular area. Chemoptogenetic ablation causes accumulation of macrophages inside the ventricle between 3- and 7 dpi. At 15- and 30 dpi, the number of macrophages is comparable to control. At least n = 4 for each group. *P < .05; ***P < .001; ****P < .0001; one-way ANOVA. Scale bar = 100 μm |
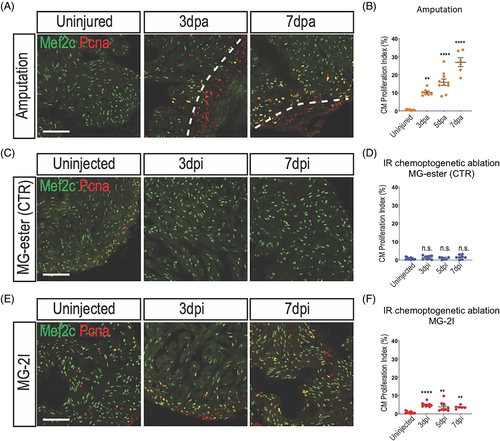
Cardiomyocyte proliferate after chemoptogenetic ablation. A, Mef2c and Pcna staining in amputated ventricles. White dashed lines indicate injury area. Amputation induced cardiomyocyte proliferation. B, Graph showing the percentage of proliferating cardiomyocytes before and after amputation. Cardiomyocyte proliferation started at 3 dpa and peaked at 7 dpa. **P < .01; ****P < .0001; one-way ANOVA. C, Tg(myl7:fapdl5-cerulean) hearts injected with control MG-ester and treated with near IR-light, stained for Mef2c and Pcna. D, Quantification of cardiomyocyte proliferation in hearts treated with MG-ester. E, Mef2c and Pcna staining before and after cardiomyocyte chemoptogenetic ablation. F, Graph showing the percentage of proliferating cardiomyocytes before and after ablation. MG-2I induced cardiomyocytes proliferation from 3 to 7 dpi. At least n = 6 for each group. **P < .01; ****P < .0001; one-way ANOVA. Scale bar = 100 μm |
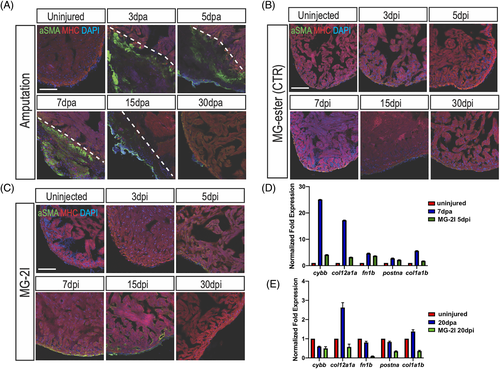
Myofibroblasts are mildly activated upon cardiomyocyte chemoptogenetic ablation. A, Activated fibroblasts (αSMA) and MHC (cardiac muscle) immunostaining before and after ventricular amputation at several time points. In uninjured ventricles αSMA staining is not detectable. After amputation, αSMA staining is visible inside the injury but by 30 dpa activated fibroblasts were not detected. B, Tg(myl7:fapdl5-cerulean) hearts injected with control MG-ester and treated with near IR-light, stained for αSMA and MHC. αSMA was not detected at any time point. C, In chemoptogenetic ablated hearts, myofibroblasts are weakly activated starting at 5 dpi, until 15 dpi. At least n = 3 for each time point. Q-PCR of cytochrome b, (cybb), collagen (col12a1a and col1a1b), fibronectin (fn1b), and periostin a (postna) in amputated and ablated hearts at 7 days and 5 days (D) and at 20 days (E). Scale bar = 100 μm |
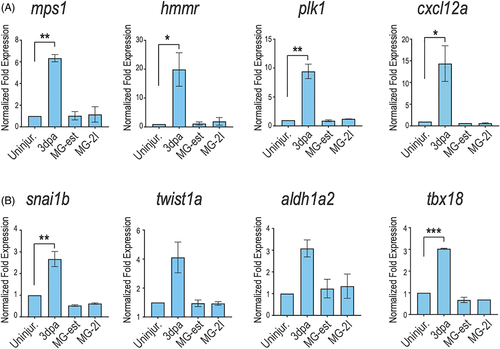
Several cardiac regeneration markers are not reactivated upon cardiomyocyte chemoptogenetic ablation. A, Q-PCR for several cardiac regeneration markers (mps1, hmmr, plk1, cxcl12a) at 3 days after amputation or genetic ablation. Increased expression of regeneration genes was noted in amputation model but not upon ROS-induced cardiomyocyte ablation. B, Q-PCR for epicardial markers (snai1b, twist1a, aldh1a2, and tbx18) at 3 days after injury. Amputation induced epicardial gene expression at 3 days, but ROS-induced ablation did not. *P < .05; **P < .01; ***P < .001; one-way ANOVA. Values without asterisks are not statistically different from uninjured control samples using one-way ANOVA |