
|
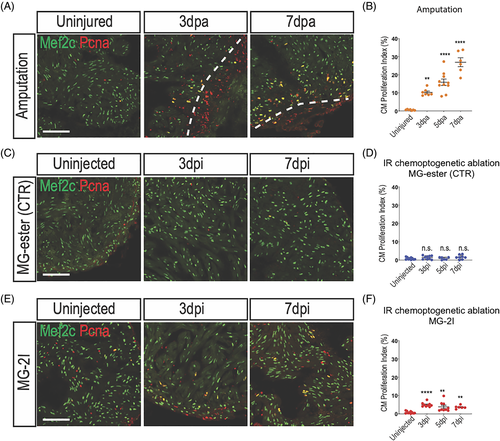
Fig. 6 Cardiomyocyte proliferate after chemoptogenetic ablation. A, Mef2c and Pcna staining in amputated ventricles. White dashed lines indicate injury area. Amputation induced cardiomyocyte proliferation. B, Graph showing the percentage of proliferating cardiomyocytes before and after amputation. Cardiomyocyte proliferation started at 3 dpa and peaked at 7 dpa. **P < .01; ****P < .0001; one-way ANOVA. C, Tg(myl7:fapdl5-cerulean) hearts injected with control MG-ester and treated with near IR-light, stained for Mef2c and Pcna. D, Quantification of cardiomyocyte proliferation in hearts treated with MG-ester. E, Mef2c and Pcna staining before and after cardiomyocyte chemoptogenetic ablation. F, Graph showing the percentage of proliferating cardiomyocytes before and after ablation. MG-2I induced cardiomyocytes proliferation from 3 to 7 dpi. At least n = 6 for each group. **P < .01; ****P < .0001; one-way ANOVA. Scale bar = 100 μm