
- Title
-
Hexavalent chromium amplifies the developmental toxicity of graphene oxide during zebrafish embryogenesis
- Authors
- Chen, Y., Li, J., Zhou, Q., Liu, Z., Li, Q.
- Source
- Full text @ Ecotoxicol. Environ. Saf.
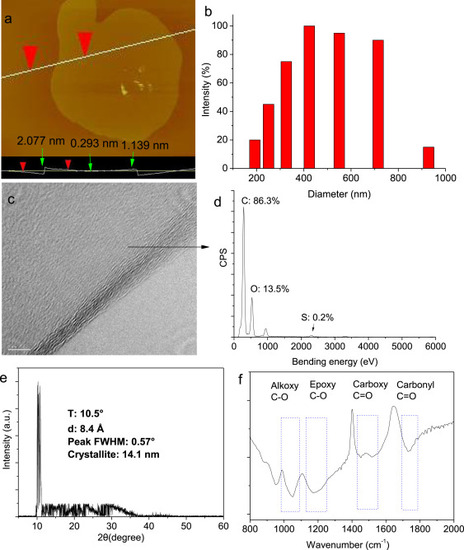
Fig. 1. Characterization of GO. (a) Atomic force microscope image. (b) The hydrodynamic diameter. (c) High-resolution transmission electron microscope image. (d) The atomic percentage measured by energy-dispersive spectroscopy. (e) X-ray diffraction analysis. (f) Fourier transform infrared spectroscopy. |
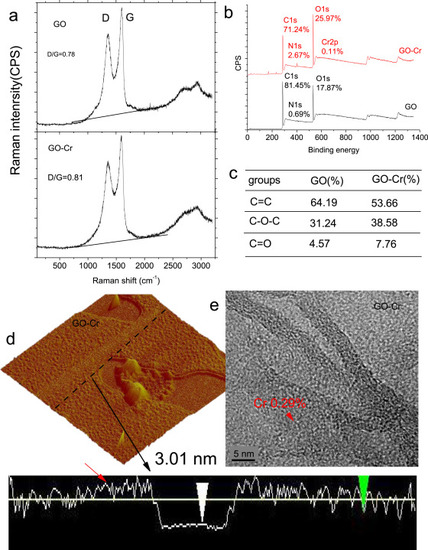
Fig. 2. Structural alterations of GO modified by Cr6+. (a) Raman spectra. The labels of D and G denote the typical Raman spectral peaks of GO and GO-Cr. (b) X-ray photoelectron spectroscopy. (c) The specific compositions of the C 1 s signals. (d) Atomic force microscope image. Red arrow denotes the structural defects in GO sheets (e) High-resolution transmission electron microscope image. The content of Cr in GO was measured by energy-dispersive spectroscopy (For interpretation of the references to colour in this figure legend, the reader is referred to the web version of this article). |
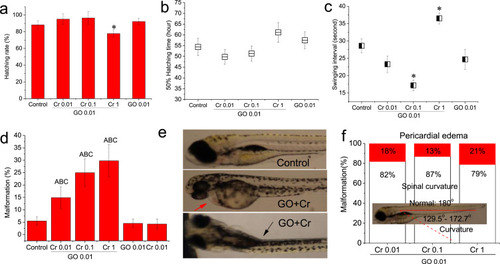
Fig. 3. Effects of GO co-exposure with Cr6+ on zebrafish embryo development. (a) Hatching rate of embryos at 72 hpf (n = 40). (b) 50% hatching time, indicates the time of 50% embryos hatching from the chorion (n = 40). (c) Swing interval, indicates time interval between two contiguously embryo movement at 48 hpf (n = 6). (d) Malformation rate of embryo at 120 hpf (n = 40). The upper case A, B and C denote significant difference at the p < 0.05 level when the co-exposure groups compared with control, GO and Cr6+, respectively. (e) Representative images of embryo malformation. Red arrow denotes pericardial edema, black arrow denotes spinal curvature. (f) Relative ratio of malformations. Red-filled rectangle denotes the ratio of pericardial edema. White-filled rectangle denotes the ratio of spinal curvature. The spine of normal fish as to be 180° (For interpretation of the references to colour in this figure legend, the reader is referred to the web version of this article). |
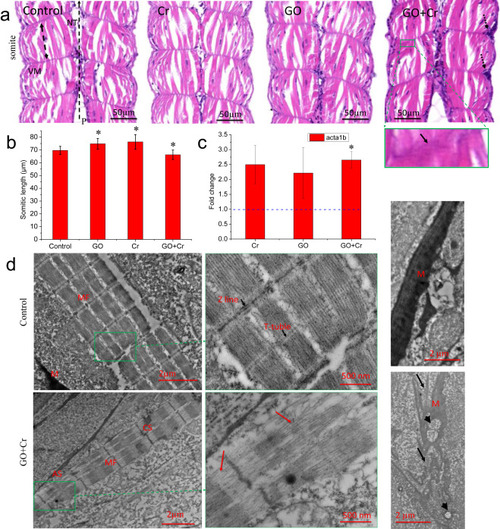
Fig. 4. Effects of GO co-exposure with Cr6+ on the development of muscular system. (a) Representative micrographs of H&E-stained zebrafish sections. NT, the neural tube; VM, the vertical myosepta; P, posterior; the double-headed arrow denotes the length of somite, the dotted arrows denote the aggregation of haemocytes, the green square denotes a detailed view of vertical myosepta. (b) Semi-quantitative analysis of the somite length. 18 images from 6 embryos in a treatment group. *denotes significant at the p < 0.05 level. Data are presented as mean ± SD. (c) Relative mRNA level for the gene acta1b. Relative expression levels were calculated according to the 2−∆∆CT method with the control group as a calibrator (relative expression = 1). *denotes significant at the p < 0.05 level, n = 3. Data are presented as mean ± SD. (d) Transmission electron microscopy images. Red arrow denotes the damage of sarcostyle. Black arrow denotes the damage of myosepta. MF, muscle fiber; M, myosepta; AS, absent sarcomeres; CS, collapsed sarcomeres; the arrows denote the fragmented myoseptum and the arrowheads denote the vacuole (For interpretation of the references to colour in this figure legend, the reader is referred to the web version of this article). |
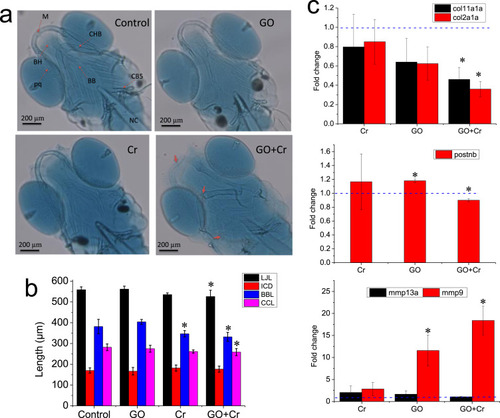
Fig. 5. Effects of GO co-exposure with Cr6+ on zebrafish cartilage development. (a) Representative micrographs of alcian blue-stained cartilage. M, Meckel’s cartilages; BH, basihyal; pq, palatoquadrate; CHB, ceratohyal bone; BB, basibranchial; CB5, ceratobranchial 5; NC, notochord. (b) Semi-quantitative analysis of zebrafish cartilage. *denotes significant at the p < 0.05 level. n = 6. Data are presented as mean ± SD. LJL, the lower jaw length; ICD, the intercranial distance; BBL, the basibranchial length; CCL, the ceratohyal cartilage length. (c) Relative mRNA level for skeletal development. Relative expression levels were calculated according to the 2−∆∆CT method with the control group as a calibrator (relative expression = 1). Significant differences in the relative expression level for each gene between the treated and control groups were determined using t-test. *denotes significant at the p < 0.05 level, n = 3. Data are presented as mean ± SD. |
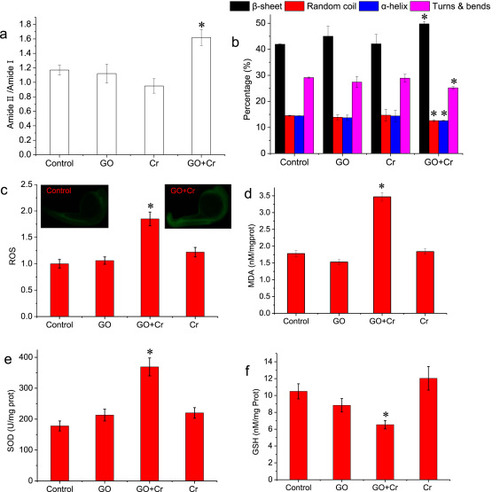
Fig. 6. Proteinic damage and oxidative stress of zebrafish embryos induced by Cr6+ in the absence or presence of GO. (a) Composition of the overall protein pattern. (b) Percentage of the protein secondary structure. (c) ROS. Insets showed the position of fluorescence (d) MDA. (e) SOD. (f) GSH. *denotes significant at the p < 0.05 level, n = 3. Data are presented as mean ± SD. ROS, reactive oxygen species. SOD, superoxide dismutase. GSH, glutathione. MDA, malondialdehyde. |