
Image
|
Figure Caption
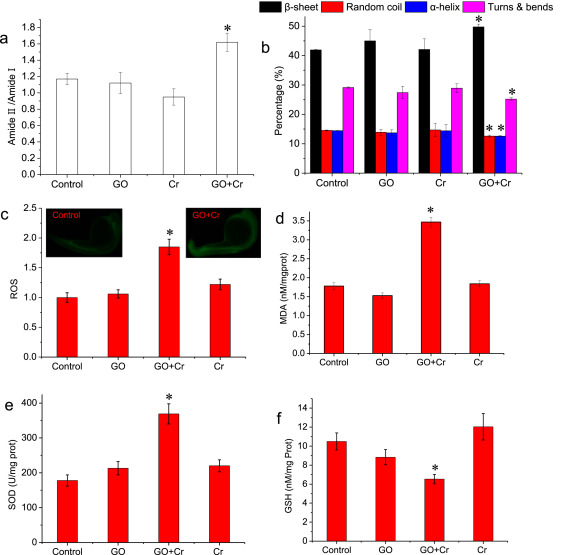
Fig. 6 Fig. 6. Proteinic damage and oxidative stress of zebrafish embryos induced by Cr6+ in the absence or presence of GO. (a) Composition of the overall protein pattern. (b) Percentage of the protein secondary structure. (c) ROS. Insets showed the position of fluorescence (d) MDA. (e) SOD. (f) GSH. *denotes significant at the p < 0.05 level, n = 3. Data are presented as mean ± SD. ROS, reactive oxygen species. SOD, superoxide dismutase. GSH, glutathione. MDA, malondialdehyde.
Acknowledgments
This image is the copyrighted work of the attributed author or publisher, and
ZFIN has permission only to display this image to its users.
Additional permissions should be obtained from the applicable author or publisher of the image.
Full text @ Ecotoxicol. Environ. Saf.