
|
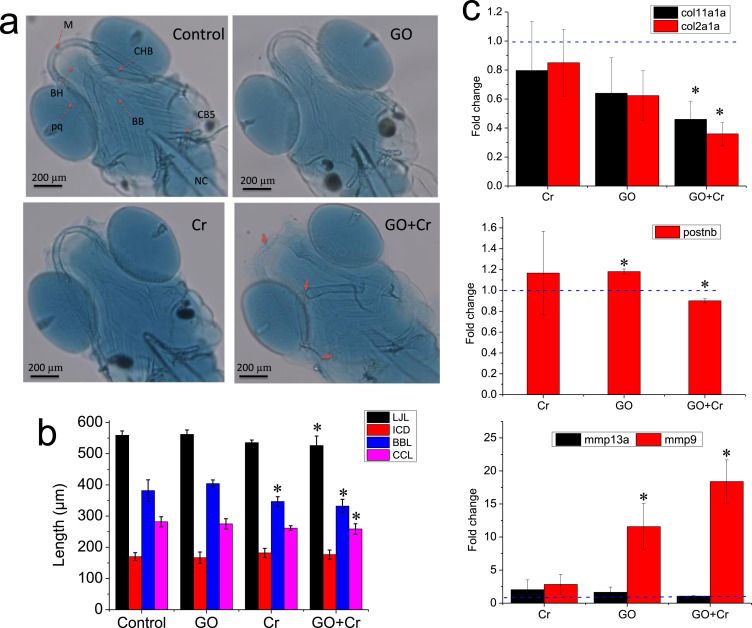
Fig. 5 Fig. 5. Effects of GO co-exposure with Cr6+ on zebrafish cartilage development. (a) Representative micrographs of alcian blue-stained cartilage. M, Meckel’s cartilages; BH, basihyal; pq, palatoquadrate; CHB, ceratohyal bone; BB, basibranchial; CB5, ceratobranchial 5; NC, notochord. (b) Semi-quantitative analysis of zebrafish cartilage. *denotes significant at the p < 0.05 level. n = 6. Data are presented as mean ± SD. LJL, the lower jaw length; ICD, the intercranial distance; BBL, the basibranchial length; CCL, the ceratohyal cartilage length. (c) Relative mRNA level for skeletal development. Relative expression levels were calculated according to the 2−∆∆CT method with the control group as a calibrator (relative expression = 1). Significant differences in the relative expression level for each gene between the treated and control groups were determined using t-test. *denotes significant at the p < 0.05 level, n = 3. Data are presented as mean ± SD.