
|
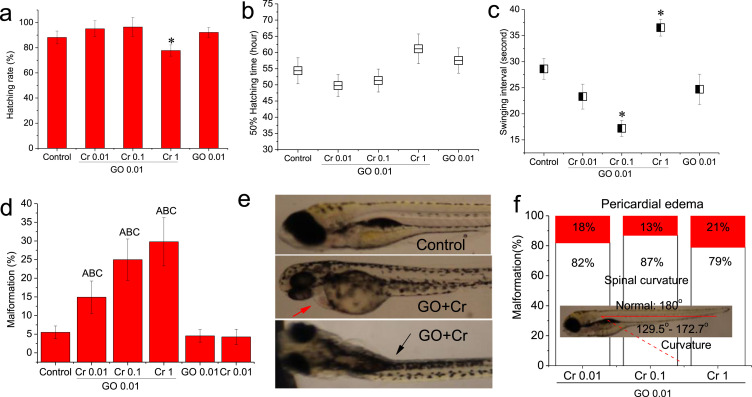
Fig. 3 Fig. 3. Effects of GO co-exposure with Cr6+ on zebrafish embryo development. (a) Hatching rate of embryos at 72 hpf (n = 40). (b) 50% hatching time, indicates the time of 50% embryos hatching from the chorion (n = 40). (c) Swing interval, indicates time interval between two contiguously embryo movement at 48 hpf (n = 6). (d) Malformation rate of embryo at 120 hpf (n = 40). The upper case A, B and C denote significant difference at the p < 0.05 level when the co-exposure groups compared with control, GO and Cr6+, respectively. (e) Representative images of embryo malformation. Red arrow denotes pericardial edema, black arrow denotes spinal curvature. (f) Relative ratio of malformations. Red-filled rectangle denotes the ratio of pericardial edema. White-filled rectangle denotes the ratio of spinal curvature. The spine of normal fish as to be 180° (For interpretation of the references to colour in this figure legend, the reader is referred to the web version of this article).