
|
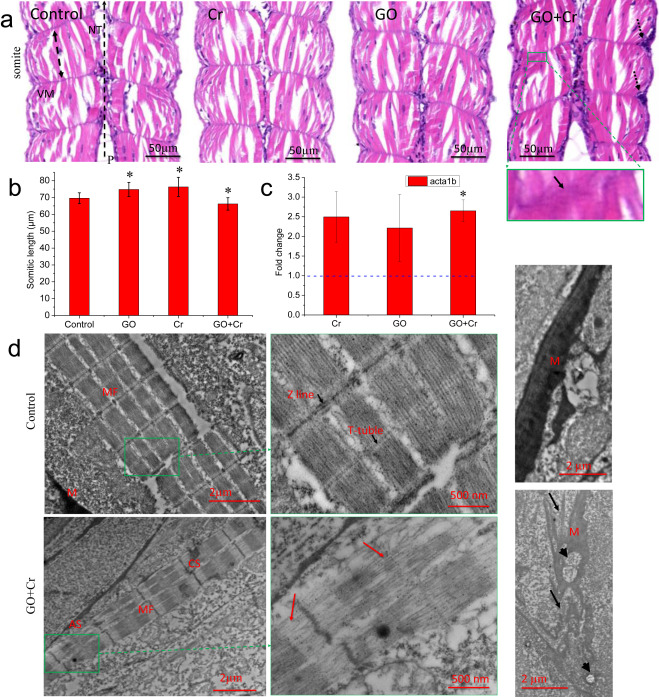
Fig. 4 Fig. 4. Effects of GO co-exposure with Cr6+ on the development of muscular system. (a) Representative micrographs of H&E-stained zebrafish sections. NT, the neural tube; VM, the vertical myosepta; P, posterior; the double-headed arrow denotes the length of somite, the dotted arrows denote the aggregation of haemocytes, the green square denotes a detailed view of vertical myosepta. (b) Semi-quantitative analysis of the somite length. 18 images from 6 embryos in a treatment group. *denotes significant at the p < 0.05 level. Data are presented as mean ± SD. (c) Relative mRNA level for the gene acta1b. Relative expression levels were calculated according to the 2−∆∆CT method with the control group as a calibrator (relative expression = 1). *denotes significant at the p < 0.05 level, n = 3. Data are presented as mean ± SD. (d) Transmission electron microscopy images. Red arrow denotes the damage of sarcostyle. Black arrow denotes the damage of myosepta. MF, muscle fiber; M, myosepta; AS, absent sarcomeres; CS, collapsed sarcomeres; the arrows denote the fragmented myoseptum and the arrowheads denote the vacuole (For interpretation of the references to colour in this figure legend, the reader is referred to the web version of this article).