
Image
|
Figure Caption
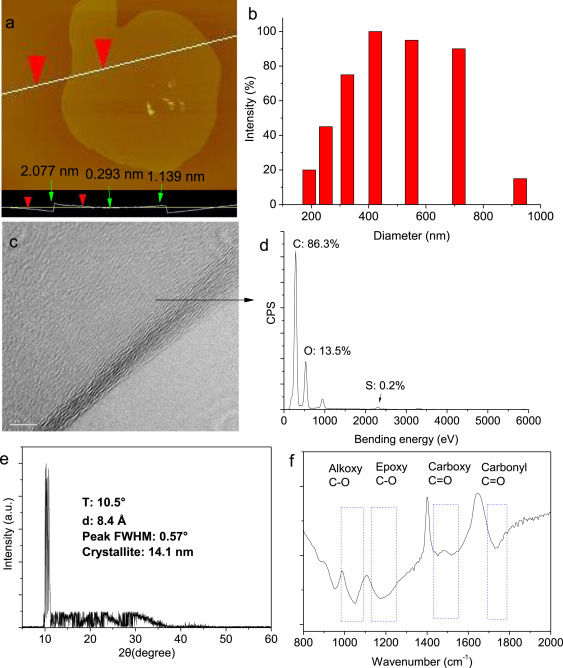
Fig. 1 Fig. 1. Characterization of GO. (a) Atomic force microscope image. (b) The hydrodynamic diameter. (c) High-resolution transmission electron microscope image. (d) The atomic percentage measured by energy-dispersive spectroscopy. (e) X-ray diffraction analysis. (f) Fourier transform infrared spectroscopy.
Acknowledgments
This image is the copyrighted work of the attributed author or publisher, and
ZFIN has permission only to display this image to its users.
Additional permissions should be obtained from the applicable author or publisher of the image.
Full text @ Ecotoxicol. Environ. Saf.