
- Title
-
ATR promotes cilia signalling; links to developmental impacts
- Authors
- Stiff, T., Casar Tena, T., O'Driscoll, M., Jeggo, P.A., Philipp, M.
- Source
- Full text @ Hum. Mol. Genet.
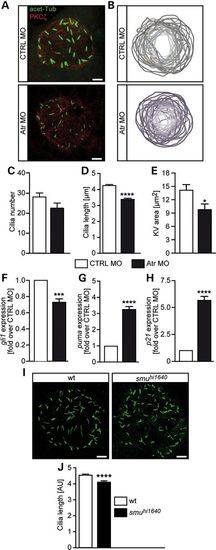
Atr depletion confers shorter cilia in zebrafish. (A) Representative images of cilia in the KV of zebrafish embryos. Cilia were stained with an antibody against acetylated tubulin. Outlines of the KV were visualized by counterstaining with an antibody against atypical PKC (PKCζ). Scale bars: 5 µm. (B) Overlay of KV outlines of CTRL MO- or Atr MO-injected embryos [eight somite stage (ss)]. Depletion of Atr results in slightly smaller KVs. (C) Cilia number was not significantly altered upon Atr depletion. Three independent experiments with 31 embryos per condition. P = 0.0770, Student′s t-test. (D) KV cilia were short in embryos depleted for Atr. n = 7. About 10-831 cilia from 29 to 31 embryos. P < 0.0001, Student′s t-test. (E) KV area measurements of CTRL- and Atr MO-injected embryos at eight ss. Three independent experiments with 31 embryos in total. P = 0.0166, Student′s t-test. (F) gli1 expression at 24 hpf after injection of either CTRL MO or Atr MO. Four independent experiments. P = 0.0008, Student′s t-test. (G) Relative expression of puma in injected embryos (24 hpf). n = 4, P < 0.0001, Student′s t-test. (H) p21 expression in 24 hpf embryos summarizing four independent experiments. P < 0.0001, Student′s t-test. (I) Representative images of KV cilia in a zebrafish mutant for Smo (smuhi1640). Scale bars: 5 µm. (J) Average cilia length in smuhi1640 mutants and wild-type littermates. n = 1094-1826 cilia from 20 to 27 singly genotyped embryos. P < 0.0001, Student′s t-test. EXPRESSION / LABELING:
PHENOTYPE:
|
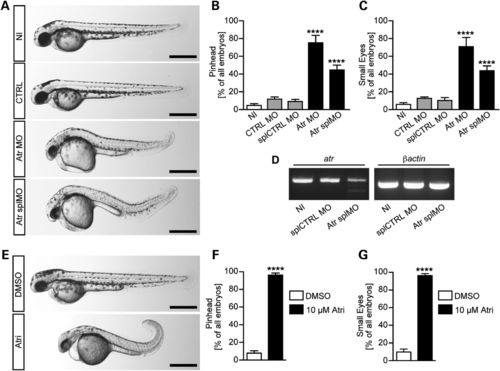
Morphological changes caused by Atr depletion in zebrafish. (A) Live images of 48 hpf zebrafish embryos. As controls, zebrafish were either left uninjected (NI) or control injected (CTRL) with a standard control MO (CTRL MO) or a 5 base mismatch MO (splCTRL MO), respectively. To generate Atr loss of function, injections with a translation blocking MO against Atr (Atr MO) or an MO interfering with Atr splicing (Atr splMO) were performed. Scale bars: 500 µm. (B) The percentage of embryos with an underdeveloped head. Graph displays mean values ± SEM, and n = 111-193 embryos in 5-11 experiments. ****P < 0.0001, one-way ANOVA. (C) Loss of Atr interferes with regular eye development. Graph displays means ± SEM, and n = 93-113 embryos in 5-11 experiments. ****P < 0.0001, one-way ANOVA. (D) Representative images of RT-PCR experiments assessing splice blocking efficiency of Atr splMO compared with controls. Left panel shows PCR of exons 2-4 of atr with a weaker band at the expected size and an additional smaller band representing the mis-spliced product upon Atr splMO injection. Right panel shows a PCR fragment of βActin as loading control. (E) Live images of zebrafish embryos (48 hpf) treated with either 1% DMSO or 10 µm Atr inhibitor (ATRi-1) from the tailbud stage on. Scale bars: 500 µm. (F) Inhibition of Atr by chemical means (ATRi-1) results in a similar reduction of the head size of 48 hpf embryos. Graph displays mean values ± SEM, and n = 95-217 embryos in five experiments. P < 0.0001, Student′s t-test. (G) The percentage of embryos developing smaller eyes upon Atr inhibition. Results show the mean values ± SEM, and n = 95-217 embryos in five experiments. P < 0.0001, Student′s t-test. PHENOTYPE:
|

Loss of Atr impairs cilia function in zebrafish. (A) WMISH of 22 ss embryos illustrating southpaw (spaw) expression in the left lateral plate mesoderm (left panel). Ambiguous (middle panel) or right-sided expression (right panel) indicates aberrant left-right asymmetry. Scale bar: 200 µm. (B) Percentage of embryos with left-sided (L), right-sided (R), ambiguous (B) or no spaw expression upon Atr MO. n= 93-125 embryos; four experiments. P < 0.0001. (C) Chemical inhibition of Atr (ATRi-1) randomizes spaw expression. n = 124-197 embryos; six experiments. P < 0.0001. (D) Representative images of WMISH for cardiac myosin light chain 2 (cmlc2) showing heart looping in 48 hpf embryos. Left panel, a correctly looped heart (D-loop); middle panel, a heart with no looping (no loop); right panel, an inversely looped heart (L-loop). A, atrium; V, ventricle. Scale bar: 100 µm. (E) Atr depletion impedes heart looping (48 hpf). Stacked bar graph displaying the percentage of embryos with a properly looped heart (D), an unlooped heart (N) or an inversely looped heart (L). n = 94-108; four experiments. P < 0.0001. (F) ATRi-1 inhibitor treatment randomizes cardiac looping similar to that observed in knockdown embryos. n = 106-243; seven experiments. P = 0.009. (G) WMISH for insulin (ins) labelling of pancreatic cells to assess abdominal situs development. Left panel, a dorsal view of a control. The ins expression domain is right of the midline (dashed line). Right panel, pancreas located left of the midline. Embryos were 48 hpf. Scale bar: 200 µm. (H) Stacked bar graph summarizing correct (R) or wrong-sided (L) expression of ins in injected embryos. n = 94-105 embryos; four experiments. P = 0.001. (I) Aberrant pancreas placement after Atr depletion (48 hpf). n = 118-245 embryos; seven experiments. P = 0.008. (J) Flat mounts of four and eight ss embryos after WMISH for Atr. Note the stronger staining and higher Atr expression in the tailbud region, where the KV forms. Anterior to the left. Scale bars: 150 µm (four ss) and 200 µm (eight ss). (K) KV-specific Atr knockdown randomizes cardiac looping. Stacked bar graph of embryos processed for cmlc2 WMISH. n = 66-67 embryos; three experiments. P < 0.0001. Significance was assessed using Fisher′s exact test. EXPRESSION / LABELING:
PHENOTYPE:
|
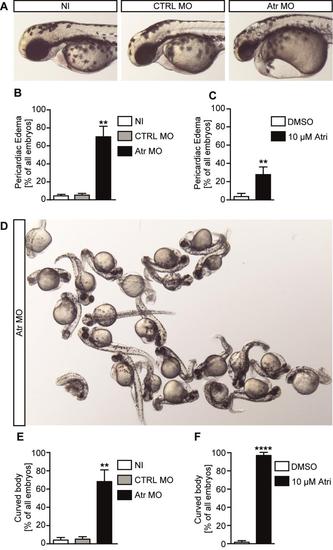
Atr morphant zebrafish display morphological phenotypes typical of cilia dysfunction. A) Live images of 48 hpf zebrafish embryos showing pericardiac edema upon Atr knockdown. Zebrafish were either left uninjected (NI) or control injected with a standard control MO (CTRL MO) or the translation blocking Atr MO. B) Percentage of embryos developing pericardiac edema. Graph displays mean values ± SEM, n=79-85 embryos in 3 experiments. ** indicates p<0.01, One way ANOVA. C) Treatment with the ATR inhibitor from tailbud stage causes pericardiac edema, too. Graph displays means ± SEM, n=55-60 embryos in 3 experiments. p=0.0025, Student’s t-test. D) Live image of a clutch of 48 hpf embryos that had been injected with Atr MO at the one cell stage. Note the large number of embryos displaying an increased body curvature, which is an indicator of a cilia dysfunction. E) Percentage of embryos with an abnormally curved body. Graph displays mean values ± SEM, n=79-85 embryos in 3 experiments. ** indicates p<0.01, One way ANOVA. F) Chemical inhibition of Atr (Atri) robustly leads to curved embryos. Results show the mean values ± SEM, n=55-60 embryos in 3 experiments. p<0.0001, Student’s t-test. PHENOTYPE:
|