
- Title
-
Apoc2 loss-of-function zebrafish mutant as a genetic model of hyperlipidemia
- Authors
- Liu, C., Gates, K.P., Fang, L., Amar, M.J., Schneider, D.A., Geng, H., Huang, W., Kim, J., Pattison, J., Zhang, J., Witztum, J.L., Remaley, A.T., Dong, P.D., Miller, Y.I.
- Source
- Full text @ Dis. Model. Mech.
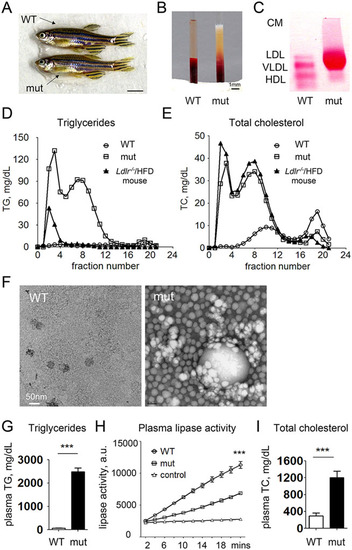
Adult apoc2 mutant zebrafish develop hyperlipidemia when fed a normal diet. (A) No apparent differences between 4-month-old male WT and apoc2 mutant (mut) zebrafish. Scale bar: 0.5cm. (B) Clear and milky appearance of plasma from WT and apoc2 mutant zebrafish, respectively. (C) Native gel electrophoresis and neutral lipid staining of plasma from WT and apoc2 mutant zebrafish. CM, chylomicron. (D,E) Fast protein liquid chromatography (FPLC) lipoprotein profile of pooled WT (45 animals) and apoc2 mutant (14 animals) zebrafish plasma. Plasma from an Ldlr/ mouse fed a 60% high-fat diet (HFD) was used for comparison. (F) Electron microscopy images of TRLs isolated from pooled WT and apoc2 mutant zebrafish plasma by ultracentrifugation as described in the Materials and Methods. (G) Plasma TG levels. Results are mean±s.e.m.; n=6 in each group; ***P<0.001 (Student′s t-test). (H) Plasma lipase activity assayed as described in the Materials and Methods. Assay buffer was used as negative control. Results are mean±s.e.m.; n=3 in each group; ***P<0.001. (I) Plasma TC levels. Results are mean±s.e.m.; n=6 in each group; ***P<0.001 (Student′s t-test). PHENOTYPE:
|

Development and angiogenesis in apoc2 mutant larvae. (A-C) Morphology of WT (n=11) and apoc2 mutant (mut, n=11) embryos at 30hpf. Results are mean±s.e.m.; ***P<0.001 (Student′s t-test). (D-G) Morphology of WT (n=11) and apoc2 mutant (n=10) embryos at 3.5dpf. Results are mean±s.e.m.; *P<0.05; **P<0.01; ***P<0.001 (Student′s t-test). The blue, red and yellow lengths highlighted in D were used to delineate the size of yolk, yolk extension and the body length, respectively. (H) Angiogenesis in fli1:EGFP WT and apoc2 mutant embryos at 28hpf (a,a′), 52hpf (b,b′) and 80hpf (c,c′). The numbers in the figure indicate the number of animals exhibiting the illustrated phenotype and the total number of animals. Scale bars: 200µm (A,D); 100µm (H). EXPRESSION / LABELING:
PHENOTYPE:
|
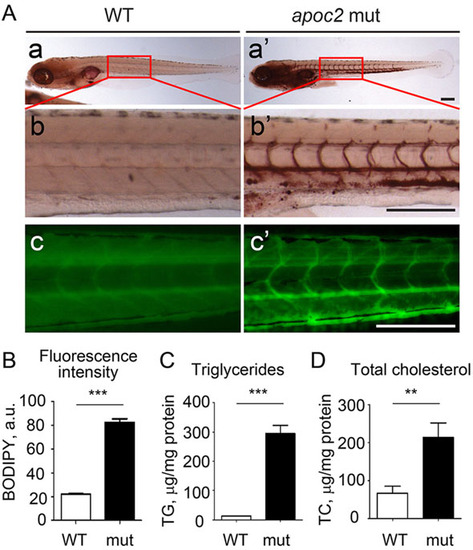
apoc2 mutant larvae develop hyperlipidemia. (A) Non-fed 6dpf WT and apoc2 mutant (mut) larvae were stained with Oil Red O (a-b′) or BODIPY (c,c′). Scale bar: 200µm. (B) Quantification of BODIPY staining in A. Results are mean±s.e.m.; n=3 in each group; ***P<0.001 (Student′s t-test). (C,D) TG and TC levels in homogenates of 6dpf WT and apoc2 mutant larvae, normalized to total protein content. Results are mean±s.e.m.; n=3 in each group; **P<0.01; ***P<0.001 (Student′s t-test). PHENOTYPE:
|
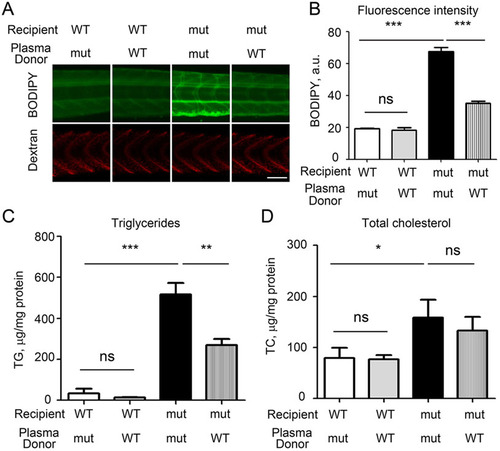
Injections of WT zebrafish plasma rescue the hyperlipidemia phenotype in apoc2 mutants. (A) apoc2 WT or mutant larvae at 5dpf were injected with 5nl of undiluted plasma from either WT or mutant (mut) adult male zebrafish, both supplemented with red fluorescent dextran. At 1 day after injection, at 6dpf, larvae were stained with BODIPY (green fluorescence) to assess the neutral lipid content of plasma. Red dextran fluorescence indicates successful injection. Scale bar: 100µm. (B) Quantification of results shown in A. Results are mean±s.e.m.; n=3 in each group; ***P<0.001; ns, not significant (Student′s t-test). (C,D) TG and TC levels in homogenates of 6dpf WT and apoc2 mutant larvae, normalized to total protein content. Results are mean±s.e.m.; five embryos pooled per sample, n=3 in each group; *P<0.05; **P<0.01 (Student′s t-test). PHENOTYPE:
|
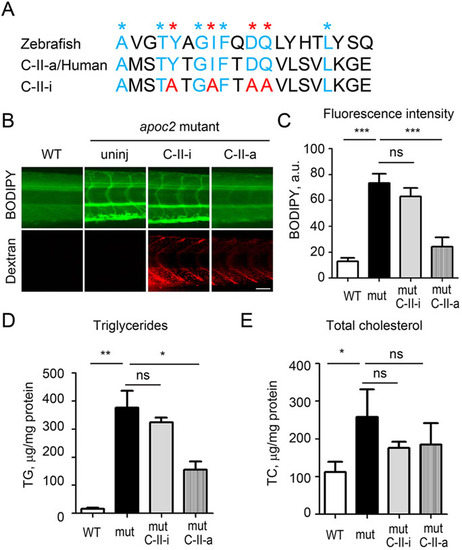
Injections of human APOC2 mimetic peptide rescue hyperlipidemia phenotype in apoc2 mutant. (A) Protein alignment of APOC2 mimetic peptides with the corresponding zebrafish Apoc2 amino acids sequence. Blue and red asterisks indicate the conserved amino acids in the C-II-a (active) peptide; red asterisks indicate amino acids that were mutated in the C-II-i (inactive) peptide. (B) At 30 h after injection of 5nl of C-II-a or C-II-i, at 6.5dpf, larvae were stained with BODIPY. Red dextran fluorescence indicates successful injection. Scale bar: 50µm. (C) Quantification of BODIPY staining results. Results are mean±s.e.m.; n=3 in each group; ***P<0.001; ns, not significant (Student′s t-test). (D,E). TG and TC levels in homogenates of 6.5dpf WT and apoc2 mutant larvae, normalized to total protein content. Results are mean±s.e.m.; five embryos pooled per sample, n=3 in each group; *P<0.05; **P<0.01; ns, not significant (Student′s t-test). PHENOTYPE:
|
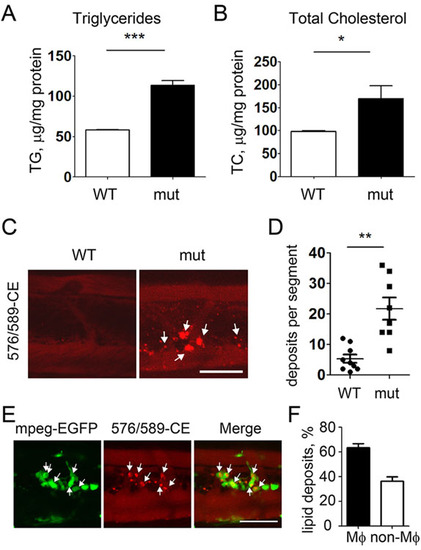
Enhanced vascular lipid accumulation in apoc2 mutants. (A,B) TG and TC levels in homogenates of 14dpf WT and apoc2 mutant (mut) larvae, normalized to total protein content. Larvae were fed a normal diet. Results are mean±s.e.m.; n=3 in each group; *P<0.05; ***P<0.001 (Student′s t-test). (C,D) Vascular lipid deposits in 14dpf WT (n=8) and apoc2 mutant (n=8) larvae fed a normal diet; **P<0.01 (Student′s t-test). (E) Colocalization of vascular lipid deposits with macrophages in 14dpf apoc2 mutant mpeg1:EGFP zebrafish. (F) Quantification of lipid deposits associated and non-associated with macrophages in apoc2 mutant larvae. Results are mean±s.e.m.; n=7. Scale bars: 50µm. EXPRESSION / LABELING:
PHENOTYPE:
|

apoc2 mutants have ectopic pancreas outgrowth. (A) Images of pancreas, labeled with EGFP driven by the ptf1a promoter, in 6.5dpf WT and apoc2 mutant (mut) larvae. The yellow arrow points to the normal pancreatic growth and white arrows point to ectopic outgrowth. Scale bar: 100µm. (B,C) At 6.5dpf, an independent observer scored a pancreatic outgrowth phenotype as 0, normal, 1, mild and 2, severe. (B) WT (n=13) and apoc2-/- mutant (n=21). Results are mean±s.e.m.; ***P<0.001 (Student′s t-test). (C) Heterozygous apoc2+/- zebrafish carrying one copy of the ptf1a-EGFP transgene were crossed with the heterozygous apoc2+/- zebrafish carrying no ptf1a-EGFP. A total of 22 embryos that displayed EGFP fluorescence were selected, scored for the pancreas outgrowth defect and then genotyped. Random ptf1a-EGFP expression resulted in the following distribution of EGFP-positive embryos: apoc2+/+ (n=3), apoc2+/- (n=9) and apoc2-/- (n=10). Results are mean±s.e.m.; *P<0.05; ***P<0.001 (Student′s t-test). |
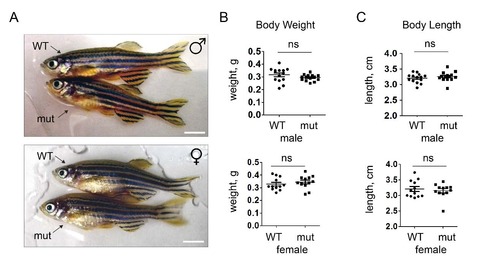
Body weight and size of adult WT and apoc2 mutant zebrafish. Physical appearance (A) and body weight and length (B) of WT (n=14) and mutant (n=14), 10 month old, male and female zebrafish. Scale bar, 0.5 cm. |

Angiogenesis in fli1:EGFP WT and apoc2 mutant zebrafish at 14 dpf. |
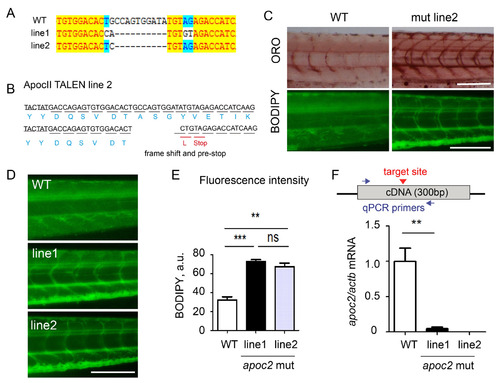
Additional apoc2 mutant zebrafish line (A) Sequence results of the apoc2 genomic DNA from the mutant line 1 (shown in Fig. 1) and the additional line 2. (B) Mutation in line 2 introduced a stop codon in the apoc2 gene. (C) BODIPY and ORO staining of WT and line 2 apoc2 mutant at 6 dpf. Scale bar, 200 µm. (D) BODIPY staining of WT and line 1 and line apoc2 mutant larvae at 6 dpf. Scale bar, 200 µm. (E) Quantification of BODIPY staining results shown in panel D. Mean±SEM; n=3 in each group; ***, p<0.001; **, p<0.01. (F) The diagram shows the position of qPCR primers relative to the mutation target site. apoc2 mRNA expression (qPCR) in whole body homogenates of 5.5 dpf WT, mutant line 1 and mutant line 2 larvae. Mean±SEM; n=3 in each group; **, p<0.01. (Part of this graph is also shown in Fig. 1G.) |

Injection of human apoC-II mimetic peptide: Time course The C-II-a and C-II-i peptides were injected as in Fig. 6. (A and B) 30 minutes after injection; (C and D) 6 hours after injection; (E and F) three days after injection. Larvae were stained with BODIPY. Red dextran fluorescence indicates successful injection. Scale bar, 50 µm. (B, D and F) Quantification of BODIPY staining results. Mean±SEM; n=3; ***, p<0.001; **, p<0.01; *, p<0.05; ns, not significant. |