
|
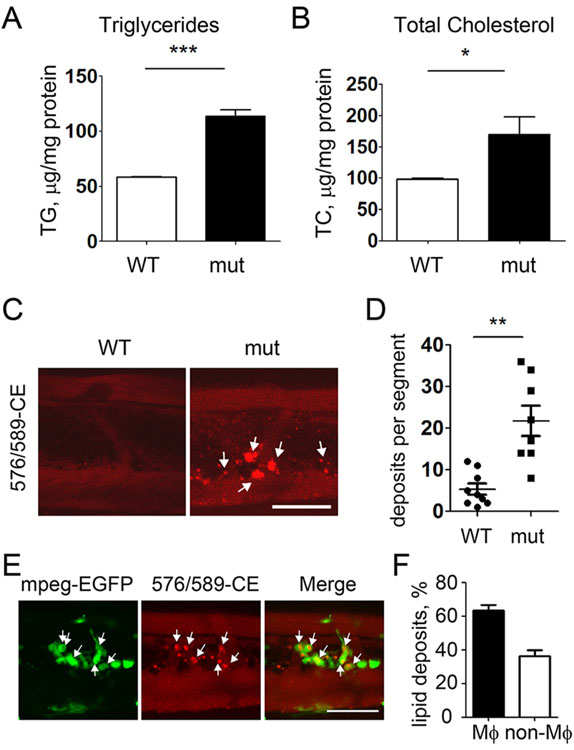
Fig. 7
Enhanced vascular lipid accumulation in apoc2 mutants. (A,B) TG and TC levels in homogenates of 14dpf WT and apoc2 mutant (mut) larvae, normalized to total protein content. Larvae were fed a normal diet. Results are mean±s.e.m.; n=3 in each group; *P<0.05; ***P<0.001 (Student′s t-test). (C,D) Vascular lipid deposits in 14dpf WT (n=8) and apoc2 mutant (n=8) larvae fed a normal diet; **P<0.01 (Student′s t-test). (E) Colocalization of vascular lipid deposits with macrophages in 14dpf apoc2 mutant mpeg1:EGFP zebrafish. (F) Quantification of lipid deposits associated and non-associated with macrophages in apoc2 mutant larvae. Results are mean±s.e.m.; n=7. Scale bars: 50µm.