
|
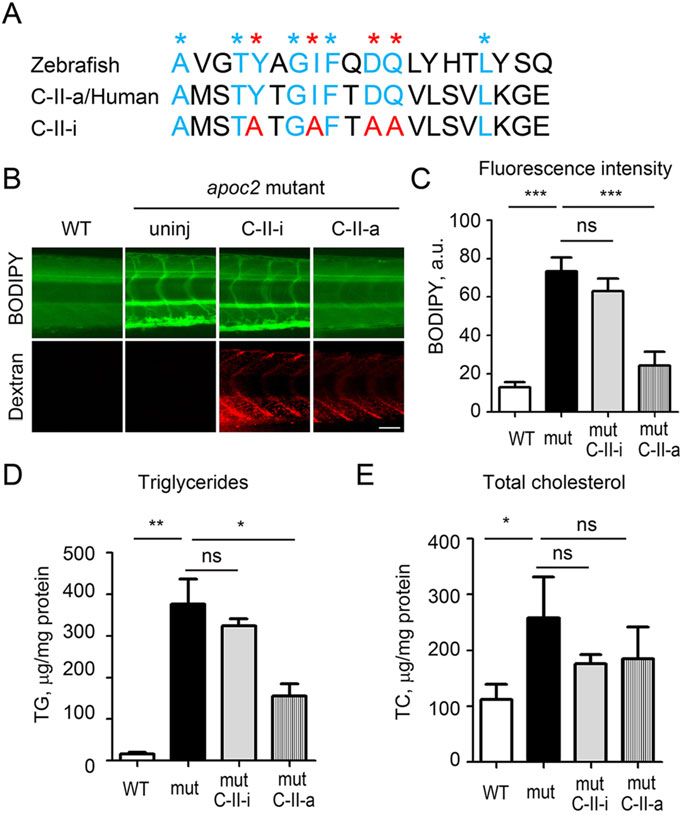
Fig. 6
Injections of human APOC2 mimetic peptide rescue hyperlipidemia phenotype in apoc2 mutant. (A) Protein alignment of APOC2 mimetic peptides with the corresponding zebrafish Apoc2 amino acids sequence. Blue and red asterisks indicate the conserved amino acids in the C-II-a (active) peptide; red asterisks indicate amino acids that were mutated in the C-II-i (inactive) peptide. (B) At 30 h after injection of 5nl of C-II-a or C-II-i, at 6.5dpf, larvae were stained with BODIPY. Red dextran fluorescence indicates successful injection. Scale bar: 50µm. (C) Quantification of BODIPY staining results. Results are mean±s.e.m.; n=3 in each group; ***P<0.001; ns, not significant (Student′s t-test). (D,E). TG and TC levels in homogenates of 6.5dpf WT and apoc2 mutant larvae, normalized to total protein content. Results are mean±s.e.m.; five embryos pooled per sample, n=3 in each group; *P<0.05; **P<0.01; ns, not significant (Student′s t-test).