
|
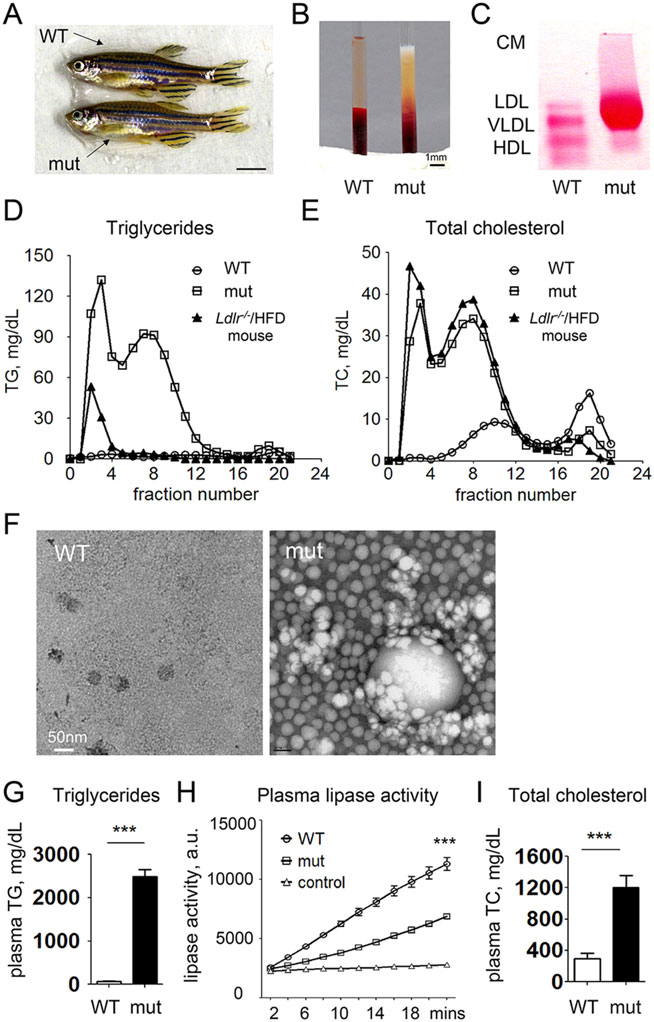
Fig. 2
Adult apoc2 mutant zebrafish develop hyperlipidemia when fed a normal diet. (A) No apparent differences between 4-month-old male WT and apoc2 mutant (mut) zebrafish. Scale bar: 0.5cm. (B) Clear and milky appearance of plasma from WT and apoc2 mutant zebrafish, respectively. (C) Native gel electrophoresis and neutral lipid staining of plasma from WT and apoc2 mutant zebrafish. CM, chylomicron. (D,E) Fast protein liquid chromatography (FPLC) lipoprotein profile of pooled WT (45 animals) and apoc2 mutant (14 animals) zebrafish plasma. Plasma from an Ldlr/ mouse fed a 60% high-fat diet (HFD) was used for comparison. (F) Electron microscopy images of TRLs isolated from pooled WT and apoc2 mutant zebrafish plasma by ultracentrifugation as described in the Materials and Methods. (G) Plasma TG levels. Results are mean±s.e.m.; n=6 in each group; ***P<0.001 (Student′s t-test). (H) Plasma lipase activity assayed as described in the Materials and Methods. Assay buffer was used as negative control. Results are mean±s.e.m.; n=3 in each group; ***P<0.001. (I) Plasma TC levels. Results are mean±s.e.m.; n=6 in each group; ***P<0.001 (Student′s t-test).