
Fig. S3
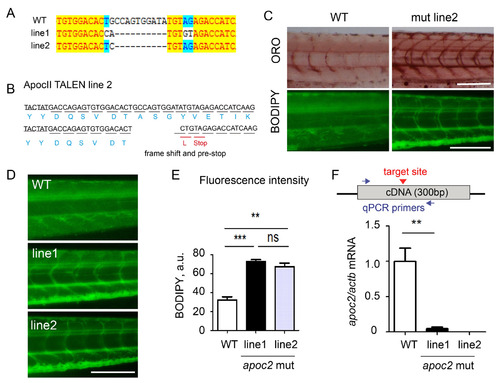
Additional apoc2 mutant zebrafish line (A) Sequence results of the apoc2 genomic DNA from the mutant line 1 (shown in Fig. 1) and the additional line 2. (B) Mutation in line 2 introduced a stop codon in the apoc2 gene. (C) BODIPY and ORO staining of WT and line 2 apoc2 mutant at 6 dpf. Scale bar, 200 µm. (D) BODIPY staining of WT and line 1 and line apoc2 mutant larvae at 6 dpf. Scale bar, 200 µm. (E) Quantification of BODIPY staining results shown in panel D. Mean±SEM; n=3 in each group; ***, p<0.001; **, p<0.01. (F) The diagram shows the position of qPCR primers relative to the mutation target site. apoc2 mRNA expression (qPCR) in whole body homogenates of 5.5 dpf WT, mutant line 1 and mutant line 2 larvae. Mean±SEM; n=3 in each group; **, p<0.01. (Part of this graph is also shown in Fig. 1G.) |