
- Title
-
Pegasus, the 'atypical' Ikaros family member, influences left-right asymmetry and regulates pitx2 expression
- Authors
- John, L.B., Trengove, M.C., Fraser, F.W., Yoong, S.H., and Ward, A.C.
- Source
- Full text @ Dev. Biol.

Zebrafish pegasus is broadly expressed during embryonic development. (A) Alternate splicing of zebrafish pegasus. The exon–intron structure of three alternatively spliced variants (1–3) of pegasus identified through ESTs. Coding and non-coding regions are displayed as thick or thin lines, respectively, with spliced introns shown with dashed lines. (B) Expression analysis of pegasus using RT-PCR. Total RNA was extracted from 4 cell, 24 hpf, 48 hpf, 72 hpf and 7 dpf embryos, as well as adult fish, and incubated in the presence of reverse transcriptase (RT), except for a control (24 hpf) sample in which the RT was omitted (RT-). PCR was performed on these samples using primers specific for pegasus and β-actin, as indicated. (C–T) Spatio-temporal expression of pegasus during embryogenesis. Zebrafish embryos at 1.25 hpf (C–D), 4 hpf (E–F), 6 hpf (G–H), 14 hpf (I–J), 24 hpf (K–L), 48 hpf (M–N), 72 hpf (O–Q) and 7 dpf (R–T) were analysed by whole-mount in situ hybridisation (WISH) using either antisense (AS: C, E, G, I, K, M, O, Q, R, and T) or sense (S: D, F, H, J, L, N, P, and S) probes specific for the pegasus gene, as indicated. Panels Q and T represent sectioned WISH embryos stained with Fast Red. The dashed lines in panel I and J indicate the position of the developing embryo. Expression of pegasus is evident by purple staining in the following labelled structures: b—body; di—diencephalon; le—lens; ep—epiphysis; fb—forebrain; fi—fin; g—gut; gcl—ganglion cell layer; h—head; hb—hindbrain; i—intestine; ir—iris; mc—mandibular cartilage; oc—optic chiasm; ov—otic vesicle; p—pancreas (exocrine); s—sphere stage embryo; t—tectum; th—thymus; and 8c—8 cell embryo. |

Targeted knockdown of zebrafish pegasus. (A) Targeting of pegasus with anti-sense morpholinos. Portion of the zebrafish pegasus gene showing encoded amino acids below the corresponding nucleotide sequence, with numbering at the left (nucleotide—black; amino acid—pink). Exons are shown in upper-case and introns in lower-case. The relative positions of the morpholinos targeting pegasus are indicated: PegUTRMO, targeting the 5′ untranslated region; PegATGMO, targeting the start codon (bold and red), and PegSSBMO, targeting a splice-site. Arrows (green) indicate the location of primers used to quantify the extent of pegasus knockdown with PegSSBMO. (B–C) Confirmation of knockdown by splice-site morpholino. Total RNA was extracted from 24 hpf embryos injected with a scrambled morpholino (ScrambleMO) or splice-site morpholino (PegSSBMO), and incubated in the presence (+) or absence () of reverse transcriptase (RT), as indicated. PCR was performed on these samples using the pegasus primer set indicated in panel A, with β-actin gene-specific primers as a control (B). The extent of knockdown was quantified by densitometric analysis of these bands across three independent experiments (C). (D–T) Molecular analysis of the developing gut and pancreas in pegasus morphants. Embryos injected with scrambled morpholino (ScrambleMO: D, N, J), pegasus ATG morpholino alone (PegATGMO: E, F, K, O, R), or with p53 morpholino (PegATGMO+p53MO: L) or morpholino-resistant mRNA (PegATGMO+mRNA: S), or pegasus splice-site blocking morpholino (PegSSBMO: G, H) were subjected to WISH at or 3 dpf with the gut-specific ifabp (D–H, J–L) and pancreas-specific insulin (N–O, Q–S) genes. Embryos are of dorsal view, with anterior to the left, with purple staining evident. Embryos were quantified with respect to the percentage expressing ifabp (I, M) or insulin (O,T) on the left, right or middle following injection with scrambled (Scr), PegATG (Peg), PegSSB (Peg-SSB) and p53 (p53) morpholino or morpholino-resistant mRNA (mRNA), as indicated. EXPRESSION / LABELING:
PHENOTYPE:
|
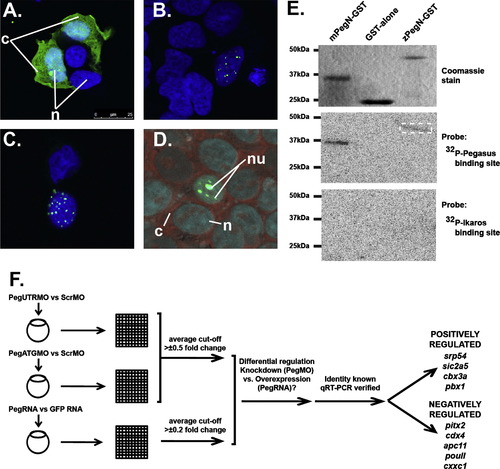
Molecular analysis of zebrafish Pegasus. (A–D) Localisation of Pegasus. Immunofluorescence analysis of HEK293T cells transfected with constructs expressing EGFP alone (A), or fused to zebrafish (B, D) or human (C) Pegasus. These were stained with DAPI alone (blue: A–C) or co-stained with SYTO81 (red: D). The relative positions of the nucleus (n), nucleolus (nu) or cytoplasm (c) are indicated. (E) DNA binding properties of Pegasus in vitro. Purified GST or GST-fusions of zebrafish or mouse Pegasus N-terminal zinc finger domains (zPegN-GST and mPegN-GST, respectively) were separated on replicate SDS-PAGE gels that were either stained with Coomassie Blue (upper panel) or transferred to a nitrocellulose membrane and probed with 32P-radiolabelled double-stranded oligonucleotides representing either the Pegasus binding site (middle panel) or Ikaros binding site (lower panel) with binding detected by autoradiography. The position of size markers are indicated on the left-hand side in each case. The dashed box highlights the faint band detected for the zPegN-GST sample. (F) In vivo gene expression analysis. Flow diagram outlining the protocol for global gene expression analysis. Total RNA was extracted from replicate sets of embryos injected with pegasus morpholino (PegUTRMO/PegATGMO) or control morpholino (ScrambleMO), and pegasus mRNA or GFP mRNA control. These sets were differentially labelled and hybridised to zebrafish-specific microarray slides, which were scanned, and the data extracted, normalised and subjected to the various statistical analysis. From the genes that showed opposite regulation in knockdown versus overexpression experiments, the Pegasus-mediated regulation of those of known identity was confirmed by qRT-PCR. These are listed according to their mode of regulation. |

Altered regulation of left–right asymmetry genes in pegasus morphants. (A) Expression profiles of zebrafish pitx2. Fold change in expression of pitx2 in embryos injected with Pegasus morpholino (MO) or RNA (over-expression) as determined by microarray analysis and qRT-PCR, as indicated in Fig. 3F. (B) Analysis of the zebrafish pitx2 gene promoter. Sequence of the 500 bp immediately upstream from the transcriptional start site of zebrafish pitx2 revealing several potential ‘atypical’ Pegasus (GNNNGNNG) binding sites (arrows above). (C–H, J–Q, T–U) WISH analysis of pitx2, lefty2 and spaw. Embryos injected with scrambled morpholino (ScrambleMO: C–E, J–K, T) or pegasus ATG morpholino (PegATGMO: F–H, L–Q, U–V) were subjected to WISH using antisense probes targeting pitx2 (C–H) and lefty2 (J–Q) at 22 hpf and spaw (T–V) at 16 hpf. Embryos are of lateral (C, F) or oblique dorsal (D–E, G–H, J–Q, T–V) view, with anterior to the left. (I, R, S, W) Asymmetry of pitx2, lefty2 and spaw. Quantitation of the percentage of embryos expressing pitx2 (I), lefty2 (R, S) or spaw (W) specifically on the left, right or both, when injected with Scramble morpholino (Scr), pegasus ATG morpholino (Peg) or pegasus ATG and p53 morpholinos (Peg+p53). EXPRESSION / LABELING:
PHENOTYPE:
|
Reprinted from Developmental Biology, 377(1), John, L.B., Trengove, M.C., Fraser, F.W., Yoong, S.H., and Ward, A.C., Pegasus, the 'atypical' Ikaros family member, influences left-right asymmetry and regulates pitx2 expression, 46-54, Copyright (2013) with permission from Elsevier. Full text @ Dev. Biol.