
|
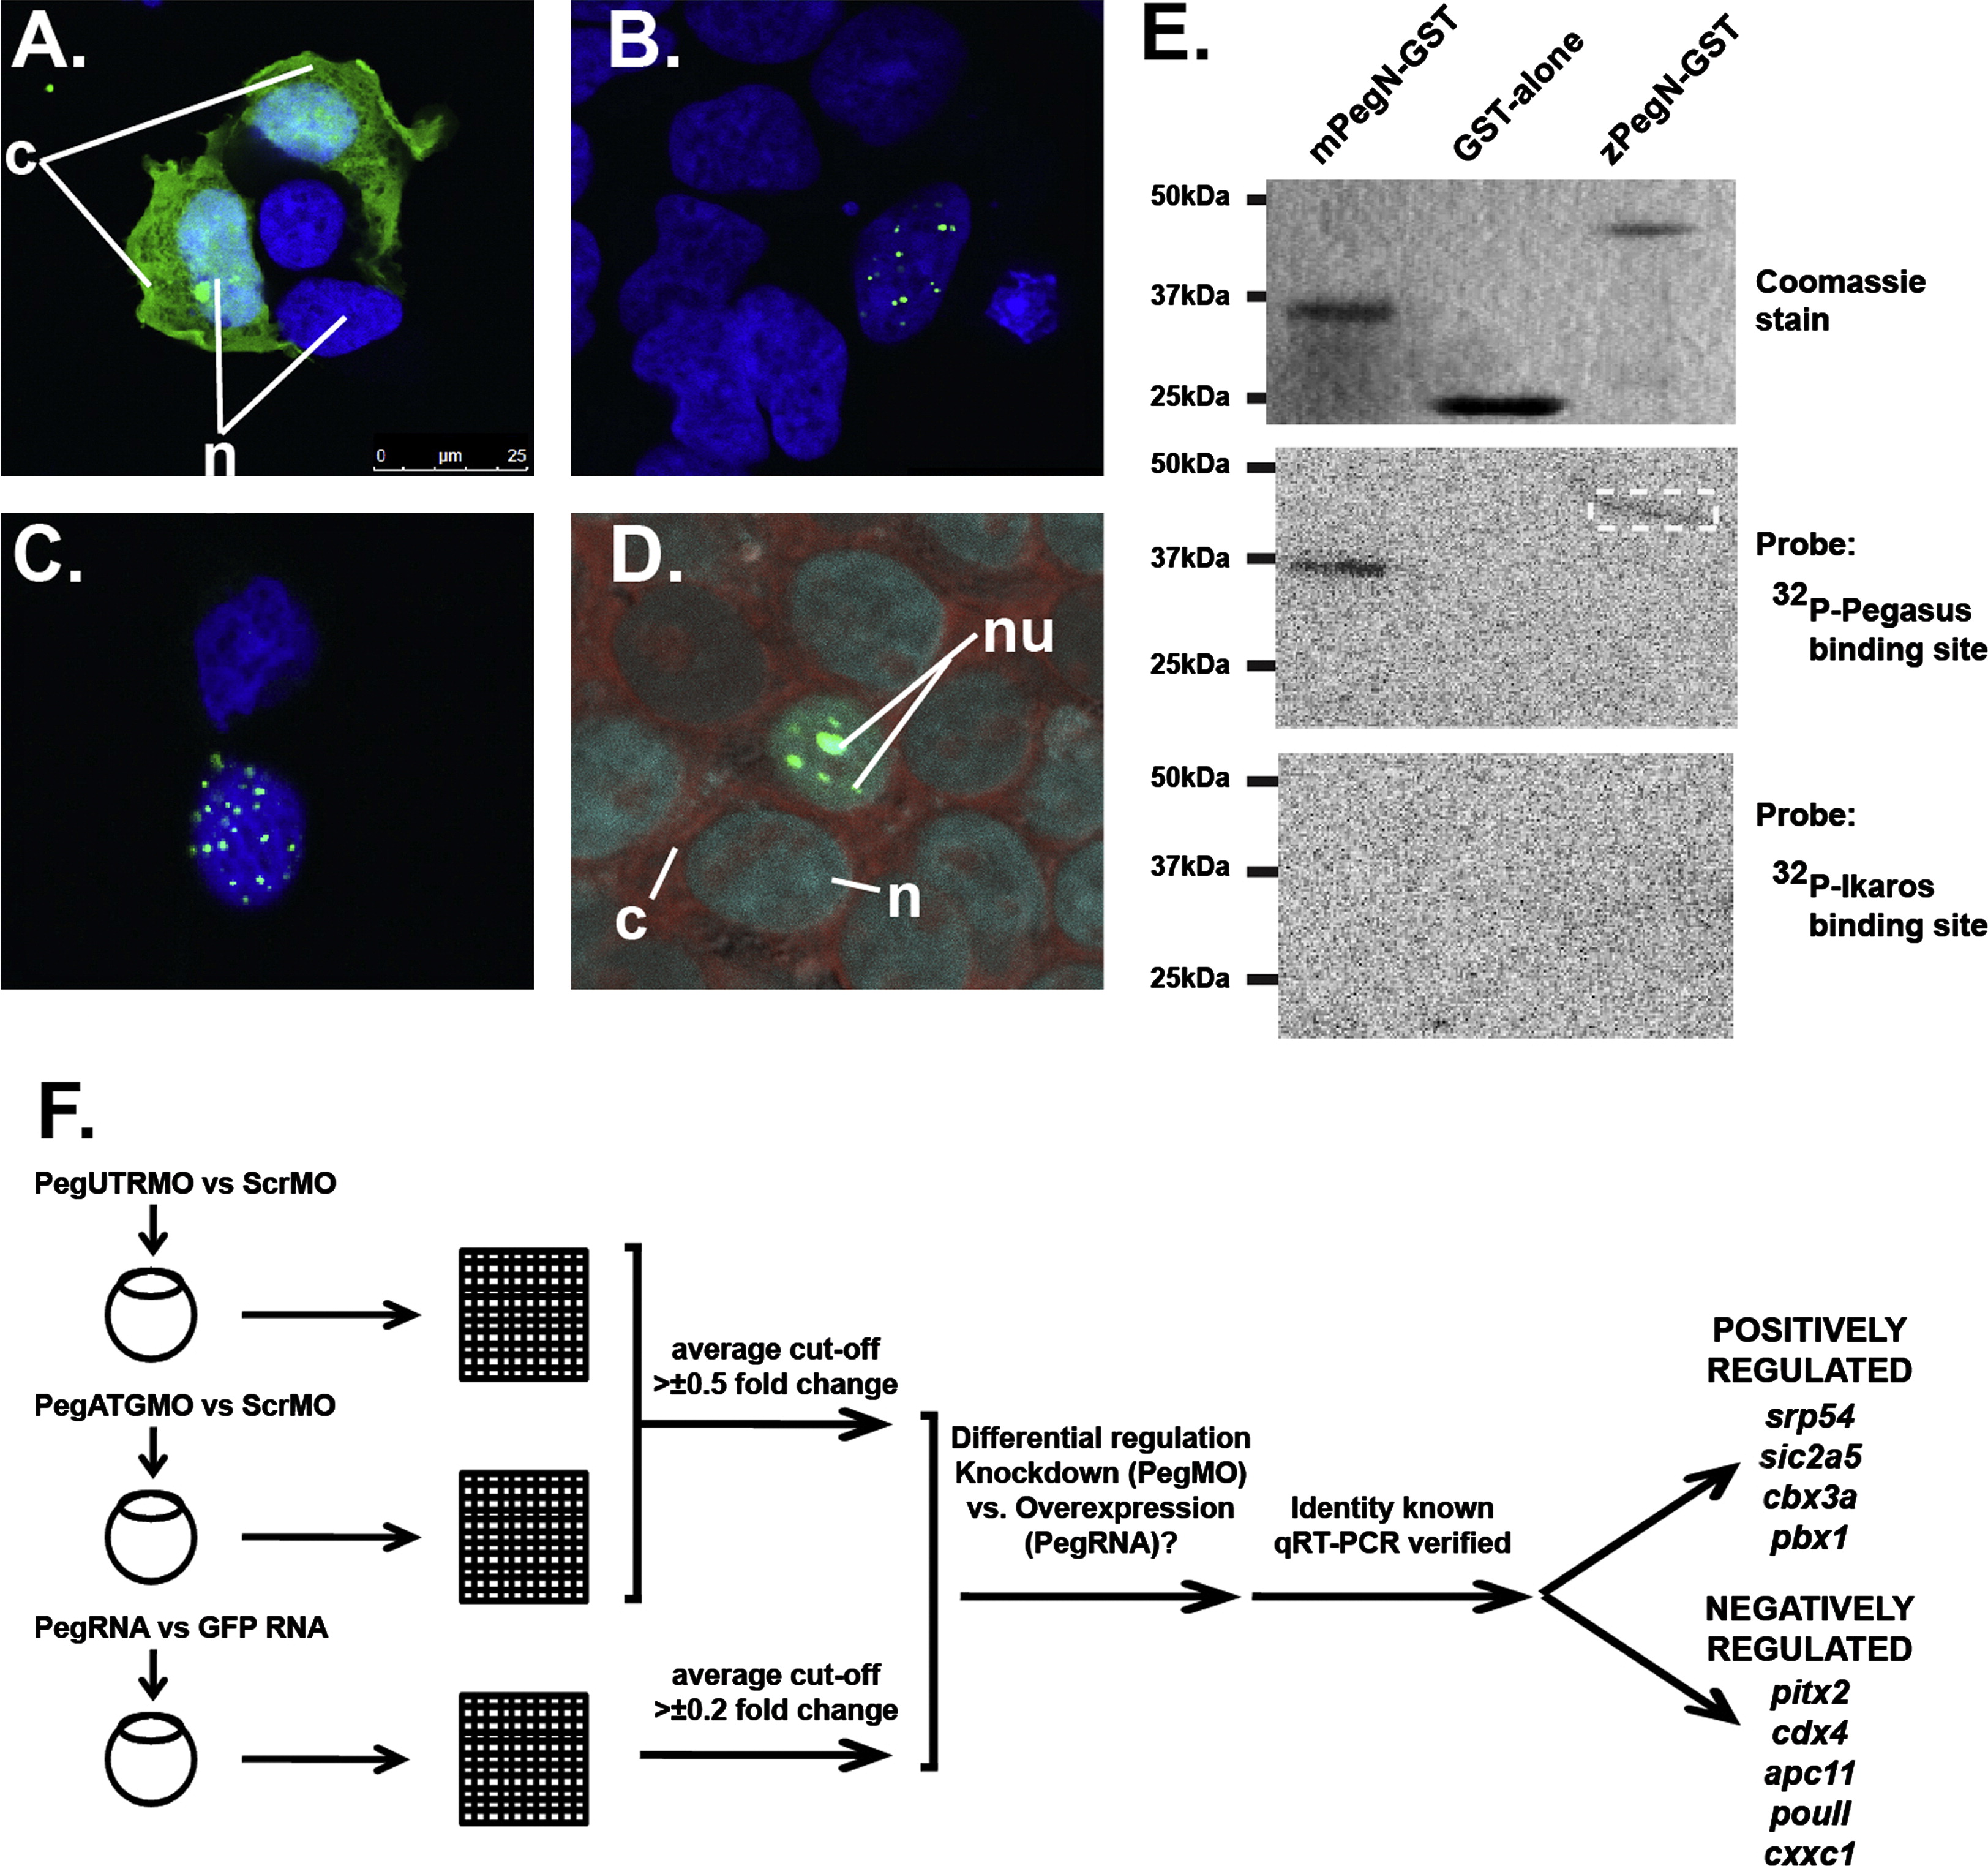
Fig. 3 Molecular analysis of zebrafish Pegasus. (A–D) Localisation of Pegasus. Immunofluorescence analysis of HEK293T cells transfected with constructs expressing EGFP alone (A), or fused to zebrafish (B, D) or human (C) Pegasus. These were stained with DAPI alone (blue: A–C) or co-stained with SYTO81 (red: D). The relative positions of the nucleus (n), nucleolus (nu) or cytoplasm (c) are indicated. (E) DNA binding properties of Pegasus in vitro. Purified GST or GST-fusions of zebrafish or mouse Pegasus N-terminal zinc finger domains (zPegN-GST and mPegN-GST, respectively) were separated on replicate SDS-PAGE gels that were either stained with Coomassie Blue (upper panel) or transferred to a nitrocellulose membrane and probed with 32P-radiolabelled double-stranded oligonucleotides representing either the Pegasus binding site (middle panel) or Ikaros binding site (lower panel) with binding detected by autoradiography. The position of size markers are indicated on the left-hand side in each case. The dashed box highlights the faint band detected for the zPegN-GST sample. (F) In vivo gene expression analysis. Flow diagram outlining the protocol for global gene expression analysis. Total RNA was extracted from replicate sets of embryos injected with pegasus morpholino (PegUTRMO/PegATGMO) or control morpholino (ScrambleMO), and pegasus mRNA or GFP mRNA control. These sets were differentially labelled and hybridised to zebrafish-specific microarray slides, which were scanned, and the data extracted, normalised and subjected to the various statistical analysis. From the genes that showed opposite regulation in knockdown versus overexpression experiments, the Pegasus-mediated regulation of those of known identity was confirmed by qRT-PCR. These are listed according to their mode of regulation.
Reprinted from Developmental Biology, 377(1), John, L.B., Trengove, M.C., Fraser, F.W., Yoong, S.H., and Ward, A.C., Pegasus, the 'atypical' Ikaros family member, influences left-right asymmetry and regulates pitx2 expression, 46-54, Copyright (2013) with permission from Elsevier. Full text @ Dev. Biol.