
- Title
-
Circadian and homeostatic regulation of structural synaptic plasticity in hypocretin neurons
- Authors
- Appelbaum, L., Wang, G., Yokogawa, T., Skariah, G.M., Smith, S.J., Mourrain, P., and Mignot, E.
- Source
- Full text @ Neuron
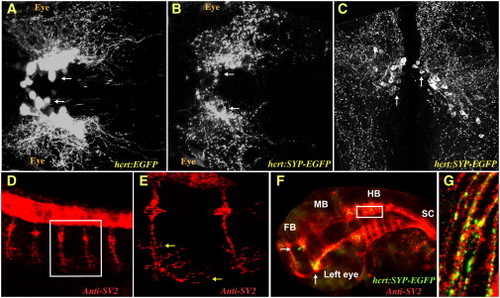
The Presynaptic SYP-EGFP Fusion Protein Is a Marker of Synapses in HCRT Axons (A and B) Two-photon microscope imaging of transgenic larvae (dorsal views of the midbrain, anterior to the left) expressing EGFP (hcrt:EGFP, A) in all HCRT neurons or the presynaptic marker synaptophysin fused to EGFP (hcrt:SYP-EGFP, B) to specifically target synapses in the axons of HCRT neurons. (C) Confocal imaging of 100 μm transversal brain sections from a stable hcrt:SYP-EGFP transgenic adult fish. HCRT cell bodies are localized around the ventricle in the hypothalamus and SYP-EGFP puncta are distributed throughout HCRT axons. (D–G) Confocal imaging (lateral views with anterior to the left) of immunohistochemistry (with SV2 antibody, D and E) and double-immunohistochemistry (with SV2 and EGFP antibodies, F and G) in a 32 hr postfertilization (hpf) embryo. (E) and (G) are close-ups of the white frames of (D) and (F), respectively. Of note, red (SV2) and green (SYP-EGFP) colocalization is marked with yellow. The following abbreviations are used: FB, forebrain; MB, midbrain; HB, hindbrain; and SC, spinal cord. White and yellow arrows indicate HCRT cell bodies and SV2 presynaptic clusters in motor neurons, respectively. |
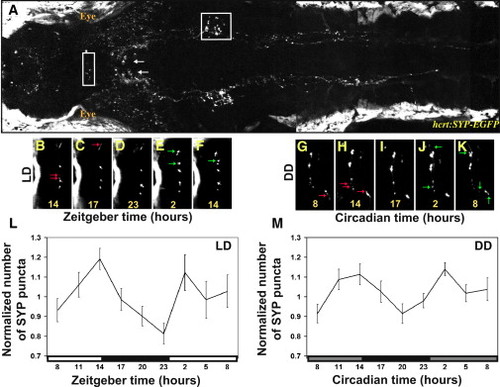
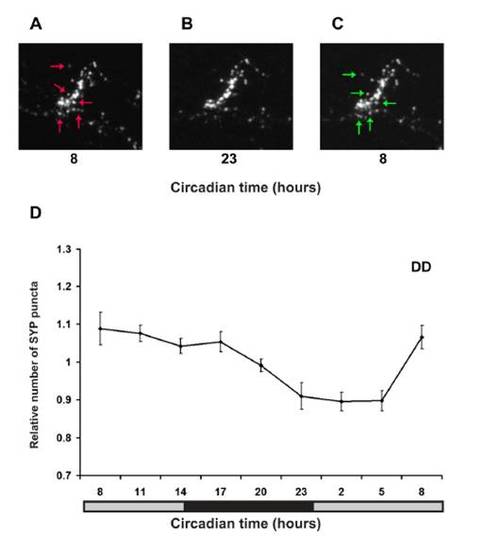
Real-Time In Vivo Analysis of Rhythmic Synaptic Density in HCRT Axons (A) Two-photon imaging of a 7 dpf stable transgenic hcrt:SYP-EGFP larva (dorsal view with head to the left). White arrows indicate HCRT cell bodies, and areas within the white frames in the midbrain and in the hindbrain are presented at higher magnification in (B)–(K) and Figure S2, respectively. (B–K) Time-lapse imaging of HCRT axons located by the pineal gland (close-ups of the white box area shown in B) in two representative hcrt:SYP-EGFP individuals (B–F under 14 light:10 dark [LD] and G–K under constant dark conditions [DD]). Examples of lost and new puncta are marked with red and green arrows, respectively. (L and M) Quantification of SYP-EGFP punctum number under LD (L, n = 12, LD represented by white and black bars) and DD (M, n = 9, gray bars represent subjective day) across 24 hr are presented. Numbers of puncta are rhythmic under both LD (p < 0.01) and DD (p < 0.01) conditions, with higher levels during the daytime. In each individual, punctum number was normalized at each time point to the mean value across the entire experiment. Repeated-measures ANOVA indicated a significant effect of time on these parameters. Each value represents normalized mean ± SEM. EXPRESSION / LABELING:
|
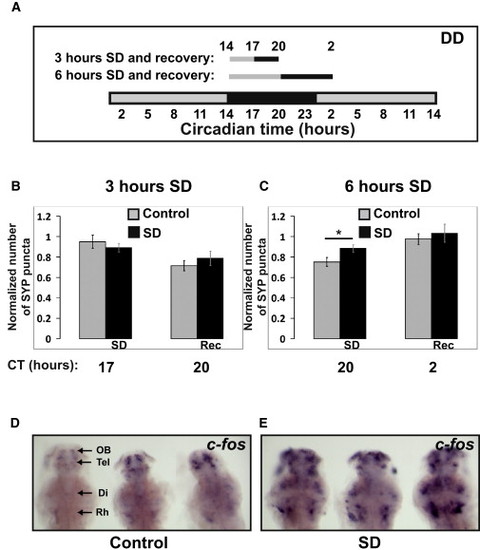
Punctum Number in HCRT Axons Increases after 6 hr of Sleep Deprivation (A–C) A schematic illustration of the SD experiments (A). Seven dpf larvae were sleep deprived for 3 (B) or 6 (C) hours at the beginning of the night (CT14). SYP-EGFP punctum number were quantified before SD (CT14 in B and C), immediately after SD (CT17 in B or CT20 in C), and after recovery (CT20 in B or CT2 in C). All experiments were performed under dark conditions (DD) and in living larvae. The number of puncta at each time point was normalized to the number recorded at the first time point (CT14) within the same individual. In all cases, with or without SD, punctum number was lower at night (see also Figure S3). Six but not three hours of SD significantly (*p < 0.05) increased the number of puncta. Statistical comparisons were performed with t tests and ANOVAs. Each value represents mean ± SEM. (D and E) Brain activity and wake is indicated by expression of c-fos mRNA in the brains of control (D) and sleep-deprived (E) larvae. All images are dorsal, with heads pointing to the top (three in each image). The following abbreviations are used: OB, olfactory bulb; Tel, telencephalon; Di, diencephalon; and Rh rhombencephalon. Similar results were obtained after 3 and 6 hr of SD. Note the efficiency of the SD procedure (D versus E). All sleep-deprived fish showed strong increases in expression. |
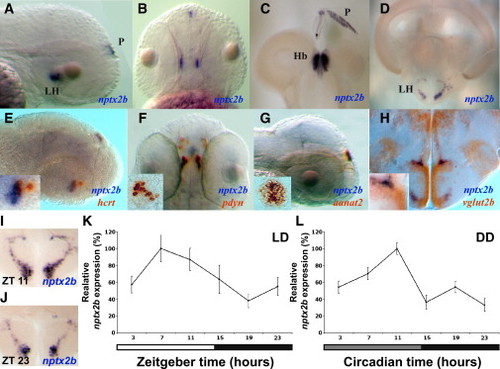
Nptx2b Cell Identity and Rhythmic nptx2b Expression in the Lateral Hypothalamus (A and B) Lateral and dorsal views of 2 dpf larvae expressing nptx2b in the lateral hypothalamus (LH) and the pineal gland (P). (C and D) Similar pattern of nptx2b expression is shown in the LH (D), the habenula (Hb, C), and the pineal gland (C) in adult fish. (E–G) Double ISH in 2 dpf larvae showing colocalization of nptx2b with hcrt (E) and pdyn (F) in the LH and with aanat2 in the pineal gland (G). (H) Double ISH in adult shows that nptx2b neurons express vglut2b, a marker of glutamatergic neurons. (I–L) Time-course analysis under light:dark (LD) and constant darkness (DD, gray bar represents subjective day) conditions demonstrates that endogenous nptx2b expression increases during the day and decreases during the night (K and L, n = 7 adult brains per time point, p < 0.001). Representative adult brain sections for day (I) and night (J) are shown. Statistical comparisons were performed with ANOVAs. Each value represents mean ± SEM. |
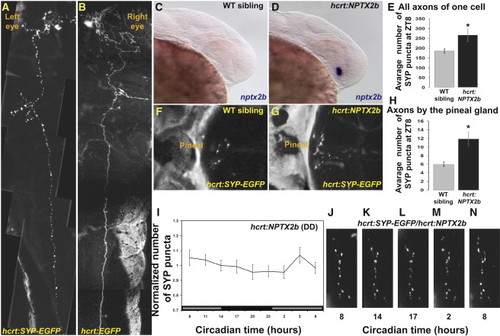
Arrhythmic Overexpression of nptx2b Increases Synaptic Density and Abolishes Synaptic Rhythms in HCRT Axons (A and B) Dorsal views, head to the left, of 4 dpf larvae transiently expressing either hcrt:SYP-EGFP (A) or hcrt:EGFP (B) transgenes. Pictures were cropped in the animal midline and juxtaposed to mirror each other for comparison. Transient expression of the SYP-EGFP presynaptic fusion protein is used to tag and quantify punctum number in all axons of single HCRT neurons (compare SYP-EGFP in A versus cytosolic EGFP in B). (C and D) Lateral views, head to the right, of 30 hpf wild-type (C) and transgenic embryos overexpressing nptx2b (hcrt:NPTX2b, D). hcrt:NPTX2b larvae (D) display strong nptx2b ISH staining, prior to the appearance of endogenous nptx2b expression in their wild-type siblings (C). (E) hcrt:SYP-EGFP transgene was injected into hcrt-NPTX2b and WT sibling embryos. Larvae 4 dpf that express EGFP in a single HCRT neuron (as shown in A) were selected. Overexpression of nptx2b in HCRT neurons increases total synapse numbers in all axons of a single HCRT neuron. (F–H) The number of puncta present on HCRT axons projecting to the pineal gland were quantified in control hcrt:SYP-EGFP (F) and hcrt:NPTX2b/hcrt:SYP-EGFP double-transgenic (G) 7 dpf fish at ZT8 (H). (I) Quantification of SYP-EGFP punctum number under DD (n = 11, gray bars represent subjective day) across 24 hr in hcrt:NPTX2b larvae. (J–N) Time-lapse imaging of HCRT axons located near the pineal gland in representative hcrt:SYP-EGFP/hcrt:NPTX2b double-transgenic individual. Note the absence of rhythmic variation. Statistical comparisons were performed with ANOVA and Student′s t tests. Each value represents mean ± SEM. |
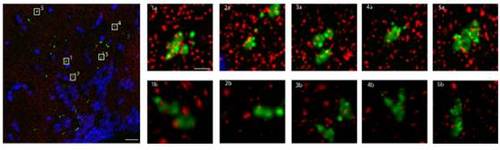
The presynaptic marker SYP-EGFP colocalizes with the post synaptic density 95 (PSD95) protein. Array tomography assay. Large Panel: Composite max projections of brain tissue from the hypothalamus of hcrt:SYPEGFP fish in a volumetric section 107.2μm by 107.4μm by 2.1μm. Red = PSD95, Green = SYP-EGFP, Blue = DAPI. Scale bar = 10μm. Small Panels: Five representative selections of SYP-EGFP puncta. 1a, 2a, 3a, 4a, 5a are max projections of 4.1μm by 4.1μm by 2.1μm subsections of the larger volume. Note the degree of superposition of PSD95 (red) to SYP-EGFP (green). Scale bar = 1μm. 1b, 2b, 3b, 4b, 5b are 3 dimensional renderings of the same piece of tissue. Note that many of the PSD95 (red) puncta that superimpose on SYP-GFP (green) are definitely separated in 3D space. It is clear, however, that for each SYP-EGFP punctum there are smaller corresponding PSD95 puncta that reside in close juxtaposition with the presynaptic marker. Out of 25 randomly selected puncta, 21 had at least 1 punctum of PSD95 within 100nm of the SYP-EGFP puncta. |
Real-time in vivo analysis of rhythmic synaptic density in HCRT axons projecting into the hindbrain. (A-C) Time-lapse imaging, under constant dark conditions (DD), of HCRT axons located in the hindbrain (close-ups of the white box area shown in Figure 2A) in representative hcrt:SYP-EGFP individual. Examples of lost and new puncta are marked with red and green arrows, respectively. (D) Quantification of SYP-EGFP punctum number under DD (n=13, gray bars represent subjective day) across 24 hours. Numbers of puncta are rhythmic (repeated measures ANOVA, p<0.05) with lower levels during the daytime. Each value represents normalized mean ± SEM. |
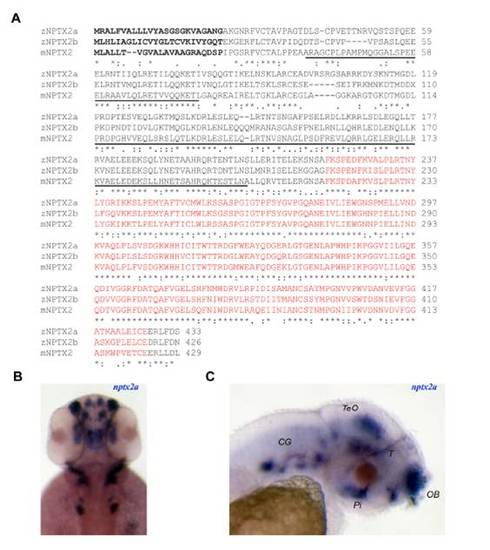
NPTX2 protein alignment and expression profile of nptx2a. (A) Alignment of mouse (m) NPTX2 (accession number: NP_058069) and zebrafish (z) NPTX2a (FJ232033) and NPTX2b (FJ232032) protein sequences. The N-terminal is predicted to form coiled-coil domains (underlined) while the C-terminal encodes a pentraxin domain (red font). A putative signal peptide sequence region is indicated in bold. (B, C) Dorsal (B) and lateral (C) views of 2 dpf larvae demonstrate widespread nptx2a expression, most notably in the olfactory bulb (OB), midbrain tegmentum (T), tectum opticum (TeO), pituitary gland (Pi) and cranial ganglia (CG). EXPRESSION / LABELING:
|
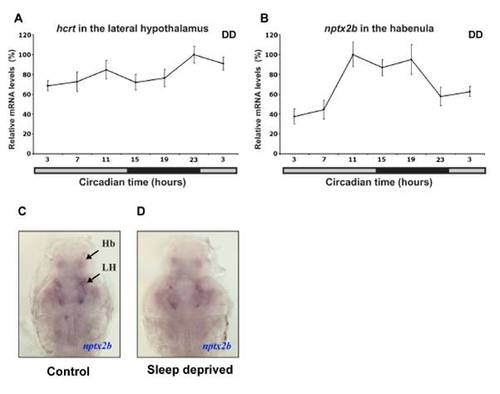
Rhythmic and arrhythmic expression of nptx2b and hcrt, respectively. (A, B) Time course analysis under constant darkness (DD, gray bar represents subjective day) in adult brain sections using in situ hybridization (ISH). Endogenous nptx2b expression in the habenula (B) is rhythmic, mostly high during the night and low during the day, (repeated measure ANOVA, p<0.05, n=7 per each time point) while hcrt expression is arrhythmic (A, n=7 per each time point). Both genes were tested in parallel in one ISH experiment under identical conditions. Each value represents mean ± SEM. (C, D) Representative nptx2b expression of control (C) and sleep deprived (D) 7dpf larvae are shown (ventral view with olfactory point to the top). No apparent differences were observed in the levels of nptx2b mRNA after 6 hours of sleep deprivation (SD, C versus D, n=25 per treatment). These experiments were performed in parallel (in sibling larvae) to the SD and c-fos ISH experiments shown in Figure 3. |
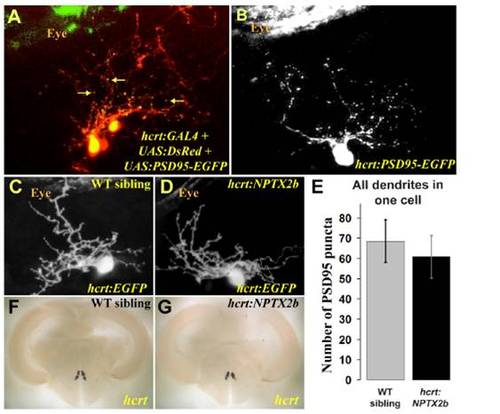
Synapse distribution in HCRT dendrites is not affected by nptx2b overexpression. (A) The PSD95-EGFP postsynaptic fusion protein was visualized (yellow dots marked with arrows) on a background of cellular DsRed in dendrites of HCRT cells in 4dpf larvae. (B) To quantify synapse number in dendrites of single HCRT neurons, PSD95-EGFP was expressed transiently, and puncta were counted in the dendrites of 4dpf larvae. (E) At 4dpf, no significant differences were found in PSD95-EGFP puncta numbers between hcrt:NPTX2b and wild-type siblings. Statistical comparisons were performed using t-tests. Error bars indicate ± SEM. (C, D, F, G) Overexpression of nptx2b is not toxic to HCRT neurons, as visualization of EGFP indicates normal morphology in 4 dpf larvae (C, D) and adult hcrt:NPTX2b fish showed normal expression of hcrt mRNA (F, G). |

Unillustrated author statements EXPRESSION / LABELING:
|