
|
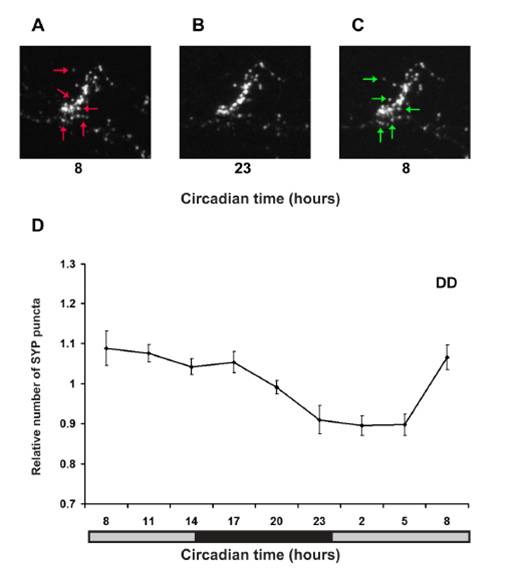
Fig. S2 Real-time in vivo analysis of rhythmic synaptic density in HCRT axons projecting into the hindbrain. (A-C) Time-lapse imaging, under constant dark conditions (DD), of HCRT axons located in the hindbrain (close-ups of the white box area shown in Figure 2A) in representative hcrt:SYP-EGFP individual. Examples of lost and new puncta are marked with red and green arrows, respectively. (D) Quantification of SYP-EGFP punctum number under DD (n=13, gray bars represent subjective day) across 24 hours. Numbers of puncta are rhythmic (repeated measures ANOVA, p<0.05) with lower levels during the daytime. Each value represents normalized mean ± SEM.