
- Title
-
Identification of novel inhibitors of dietary lipid absorption using zebrafish
- Authors
- Clifton, J.D., Lucumi, E., Myers, M.C., Napper, A., Hama, K., Farber, S.A., Smith, A.B. 3rd, Huryn, D.M., Diamond, S.L., and Pack, M.
- Source
- Full text @ PLoS One
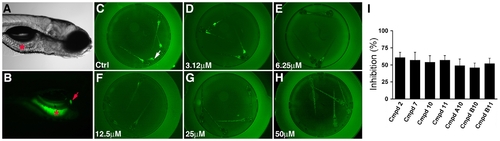
Chemical screen identifies novel inhibitors of zebrafish lipid metabolism. (A, B) Bright field and fluorescent images of a 6 day post-fertilization wild type zebrafish larva that had ingested the PED6 lipid reporter. Fluorescence is detected in the intestine (asterisk) and gallbladder (arrow). (C–H) Representative dose response assay shows inhibition of PED6 metabolism in larvae treated with compound 2. Inhibition of PED6 metabolism is first detected at 6.25 μM. Larvae (6 day post-fertilization) are arrayed in a 96-well plate. (I) Quantification of the effect of active compounds (25 μM) on PED6 metabolism, as determined by total gallbladder and intestinal fluorescence measured in individual larvae. Error bars – standard deviation. |
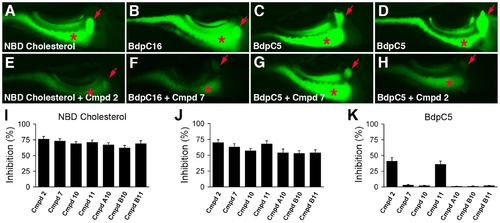
Cholesterol and fatty acid metabolism in zebrafish larvae treated with novel lipid absorption inhibitors. (A–H) Representative fluorescent images of live 6 day post-fertilization wild type and compound treated larvae following ingestion of NBD cholesterol (A, E), the LCFA BdpC16 (B, F), and the SCFA BdpC5 (C, D, G, H). All compounds used at 25 μM. Larvae treated with compound 2 showed reduced metabolism of NBD-cholesterol, BdpC16 (not shown), and BdpC5 whereas larvae treated with compound 7 have reduced metabolism of BdpC16, but not BdpC5. (I, J, K) Effect of the active compounds on lipid reporter metabolism, as determined by gallbladder and intestinal fluorescence measured from individual larvae. Red arrow - gallbladder; red asterisk - intestine. Error bars – standard deviation. |
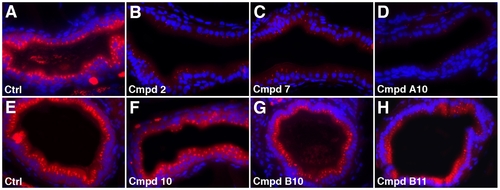
Endocytosis in zebrafish larvae treated with novel lipid absorption inhibitors. (A–H) Histological cross-sections through the anterior intestine of control and compound treated larvae following ingestion of AM1-43. AM1-43 uptake is inhibited in larvae treated with compounds 2, 7 and A10 whereas it is only slightly diminished in larvae treated with compounds 10, B10 and B11. Cell nuclei (blue) stained with Dapi. All compounds used at 25 μM. |
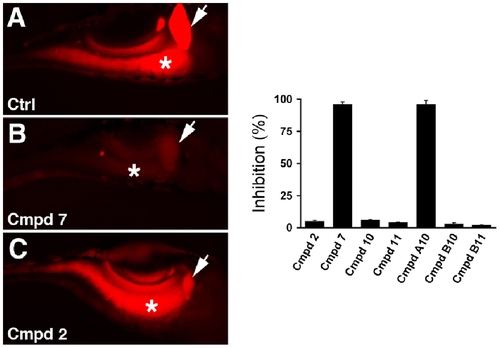
Digestive protease activity in compound treated larvae. (A–C) Representative fluorescent images of live wild type and compound treated larvae following ingestion of a quenched bodipy conjugate of casein. Bright fluorescence is seen in the intestine of the wild type larva and the larva treated with compound 2, while minimal fluorescence is detected in the intestine of the larva treated with compound 7. (D) Quantification of the effect of the active compounds on bodipy-casein metabolism, as determined by gall bladder and intestinal fluorescence measured from individual larvae. Arrow - gallbladder; asterisk - intestine. Error bars – standard deviation. All compounds used at 25 μM. |

Reduced intestinal lipid absorption in ezetimibe and compound treated zebrafish larvae. (A–L) Lateral views of 6 day post-fertilization larvae following fixation and staining with oil red o to mark neutral lipid. (A) Unfed wild type larva. (B) Wild type larva fed 1% egg yolk. Arrows point to lipid in vasculature. (C–I) Compound treated larvae (25 μM) fed 1% egg yolk. There is reduced intestinal lipid in the compound treated larvae, with no evidence of lipid in the vasculature. Hepatic lipid accumulation is not detected. Lipid is present in the intestinal lumen of larvae treated with compound 10 and ezetimibe (50 μM; blue asterisk). |
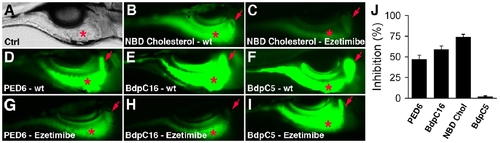
Ezetimibe inhibits lipid metabolism in zebrafish larvae. (A) Bright field image of a 6 day post-fertilization wild type (wt) zebrafish larva, lateral view. Red asterisk - intestine. (B–I) Gallbladder (red arrow) and intestinal (red asterisk) fluorescence in live 6 day post-fertilization wt and ezetimibe (50 μM) treated larvae following ingestion of fluorescent lipid reporters. (B, C) NBD-cholesterol; (D, G) PED6, (E, H) C16 bodipy (BdpC16), and (F, I) C5 bodipy (BdpC5). (J) Mean reduction in lipid reporter metabolism in ezetimibe vs wild type larvae. Error bars – standard deviation. |

Membrane cholesterol depletion and ezetimibe inhibit endocytosis and fatty acid metabolism in zebrafish larvae. (A–H) Histological cross sections through the anterior intestine of 6 day post-fertilization zebrafish larvae following ingestion and processing of the styryl dye AM1-43. (A) Red fluorescent endocytic vesicles are evident in enterocytes of a wild type larva soaked in AM1-43 for 4 hours. (B–D) Ezetimibe (50 μM) strongly inhibits AM1-43 uptake by enterocytes in a dose dependent manner. (E, F) A larva treated with methyl-β-cyclo-dextrin (MβC) shows little AM1-43 uptake 4 hours after MβC withdrawal (MβC t4) whereas AM1-43 uptake can be detected at 8 hours after MβC withdra25al (MβC t8). (G) Concomitant inhibition of cholesterol synthesis with atorvastatin (Atvn) prevents recovery of AM1-43 uptake following MβC withdrawal. (H) Atvn alone has no effect on AM1-43 uptake. (I) Metabolism of the LCFA BdpC16 (I) but not SCFA BdpC5 (J), as measured by gallbladder and intestinal fluorescence, is inhibited by membrane cholesterol depletion caused by MβC. (I) BdpC16 metabolism recovers following MβC withdrawal but not in the presence of Atvn. (J) By contrast, recovery of BdpC5 metabolism from the effects of MβC that are independent of cholesterol depletion occurs with or without Atvn treatment. |

Swallowing assay in live zebrafish larvae: (A–F) Bright field and corresponding fluorescent images of control and representative compound treated 6 dpf zebrafish larvae following ingestion of fluorescent microscphreres. (G, H) Quantification of intestinal fluorescence in compound treated and sibling control larvae. Compound 1 strongly inhibits swallowing whereas swallowing is normal in larvae treated with compound 2. Each data point represents mean intestinal fluorescence of 6 larvae. |