
Image
|
Figure Caption
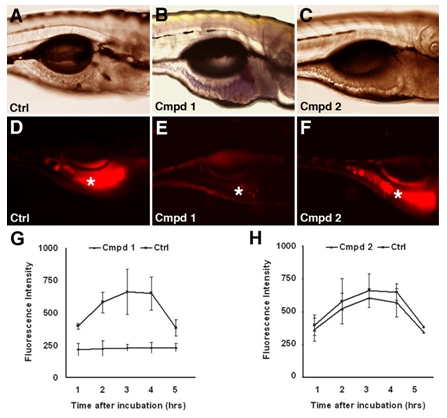
Fig. S2 Swallowing assay in live zebrafish larvae: (A–F) Bright field and corresponding fluorescent images of control and representative compound treated 6 dpf zebrafish larvae following ingestion of fluorescent microscphreres. (G, H) Quantification of intestinal fluorescence in compound treated and sibling control larvae. Compound 1 strongly inhibits swallowing whereas swallowing is normal in larvae treated with compound 2. Each data point represents mean intestinal fluorescence of 6 larvae.
Acknowledgments
This image is the copyrighted work of the attributed author or publisher, and
ZFIN has permission only to display this image to its users.
Additional permissions should be obtained from the applicable author or publisher of the image.
Full text @ PLoS One