
- Title
-
Hey2 regulates the size of the cardiac progenitor pool during vertebrate heart development
- Authors
- Gibb, N., Lazic, S., Yuan, X., Deshwar, A.R., Leslie, M., Wilson, M.D., Scott, I.C.
- Source
- Full text @ Development
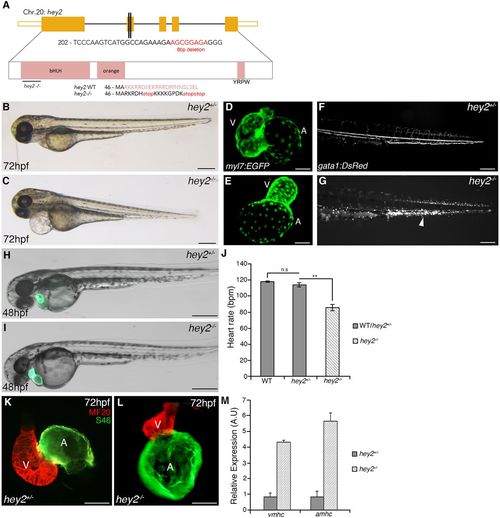
Cardiovascular defects are observed in the absence of Hey2 function. (A) Schematic representation of the hey2hsc25-null allele generated through CRISPR/Cas9-mediated genome editing. Red lettering shows 8 bp deleted sequence. Protein sequence shows production of premature stop codon at the beginning of exon 2. (B,C) Bright-field images of a sibling control and a hey2hsc25 mutant embryo at 72 hpf. (D,E) Confocal images of Tg(myl7:EGFP) hearts in control (D) and hey2 mutant (E) embryos at 72 hpf. (F,G) Fluorescent images of Tg(gata1:DsRed) showing normal blood flow in controls at 72 hpf (F) and lack of blood flow leading to the accumulation of blood cells in hey2 mutants (G, arrowhead). (H,I) Bright-field images of Tg(myl7:EGFP) in hey2 heterozygous (H) and mutant (I) embryos at 48 hpf. (J) Heart rate analysis represented as beats per minute (bpm) at 48 hpf (N=3, n=4). (K,L) MF20/S46 immunofluorescence imaging at 72 hpf in hey2 heterozygous (K) and mutant (L) embryos. A, atrium; V, ventricle. (M) Quantitative RT-PCR analysis comparing amhc and vmhc gene expression in hey2 heterozygous and mutant embryos at 48 hpf (gene expression normalized to β-actin, fold difference relative to control; N=3, n=3). Data are mean±s.e.m.; **P<0.01; n.s, not significant. Scale bars: 50 µm. EXPRESSION / LABELING:
PHENOTYPE:
|

Loss of Hey2 results in heightened cardiomyocyte number. (A,B) Confocal images showing cardiomyocyte nuclei at 48 hpf in hey2 heterozygous (A) and mutant (B) embryos. (C) Counts of cardiomyocyte numbers in the atrium and ventricle of embryos at 48 hpf (N=3, n=6 per condition). (D-G) RNA in situ hybridization analysis for expression of myl7 (D,E) and tnnt2 (F,G) at 26 hpf. Arrowheads indicate ectopic cells outside the cardiac cone in hey2 mutants. (H,I) Quantitative RT-PCR analysis of tnnt2 (H) and myl7 (I) transcript levels at 26 hpf (gene expression normalized to β-actin, fold difference relative to control; N=3, n=3). (J,K) Confocal images of cardiomyocyte nuclei in 24 hpf hey2 heterozygous (J) and hey2 mutant (K) Tg(myl7:nlsDsRedExpress) embryos. (L) Total cardiomyocyte number at 24 hpf in hey2 heterozygous and mutant embryos (N=3, n=5 per condition). Scale bars: 50 µm. Data are mean±s.e.m.; **P<0.01; ***P<0.001. A, atrium; V, ventricle; OFT, outflow tract. |
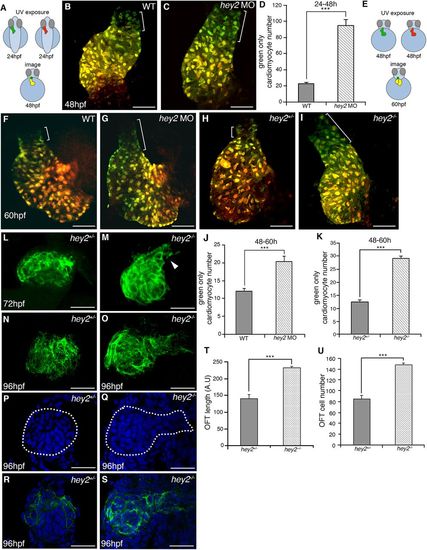
Hey2 restricts late myocardial addition to the heart tube. (A) Schematic representation of cardiomyocyte (CM) photoconversion assay between 24 and 48 hpf. (B,C) Confocal imaging at 48 hpf of control (B) and hey2 MO (C) Tg(myl7:nlsKiKGR) embryos showing cell addition as green-only CMs (bracket). (D) Bar graph showing a significant increase in green-only CMs at 48 hpf in control compared with hey2 MO embryos (N=3, n=7). (E) Schematic representation of photoconversion assay between 48 and 60 hpf. (F-I) Confocal imaging of control (F), hey2 MO (G), hey2−/+ (H) and hey2−/− (I) Tg(myl7:nlsKiKGR) embryos, highlighting cell addition between 48 and 60 h at the arterial pole (bracket). (J,K) Bar graphs documenting green-only CMs at 60 hpf in control and hey2 heterozygotes compared with morphant and mutant embryos (N=3, n=7; N=2, n=8, respectively). (L-O) DAF2-DA labeling of the OFT smooth muscle in hey2 heterozygous (L,N) and hey2 mutant (M,O) embryos at 72 and 96 hpf, respectively. Arrowhead denotes an elongated OFT. (P-S) DAPI labeling of DAF2-DA+ cells at 96 hpf in control (P,R) and hey2 mutant (Q,S) embryos. (T,U) Statistical analysis showing mean OFT lengths (T) and OFT cell number (U) in control and hey2 mutant embryos (lengths: N=2, n=11; cell number: N=3, n=4). Data are mean±s.e.m.; ***P<0.001. Scale bars: 50 µm. EXPRESSION / LABELING:
PHENOTYPE:
|
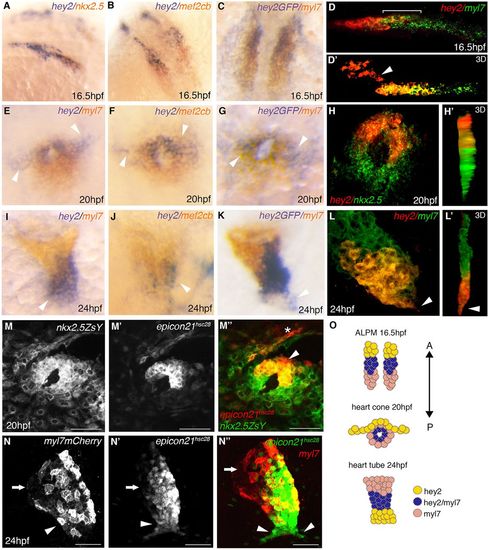
Expression of hey2 in CPCs during cardiac development. (A-L′) Double RNA in situ hybridization analysis of hey2 (A,B,D-F,H-J,L,L′) and Tg(epicon21:EGFP) expression (C,G,K) as compared with nkx2.5 (A,H,H′), myl7 (C-E,G,I,K-L′) and mef2cb (B,F,J) in wild-type embryos at 16.5 hpf (A-D), 20 hpf (E-H′) and 24 hpf (I-L′). The arrowheads in D',E-G indicate hey2+ cells outside of the cardiac (myl7+) region. (M-N″) Immunofluorescence showing Tg(epicon21:EGFP) enhancer expression when compared with Tg(nkx2.5:ZsYellow) at 20 hpf (M-M″) and Tg(myl7:mCherry-RAS) at 24 hpf (N-N″). (O) Schematic representation of hey2 and myl7 progenitor localization and movement patterns from 16.5 to 24 hpf. Scale bars: 50 µm. Asterisk labels pharyngeal mesoderm. Arrows indicate the atrium (N-N″) and arrowheads mark the ventricle (I-L′,N-N′). EXPRESSION / LABELING:
|
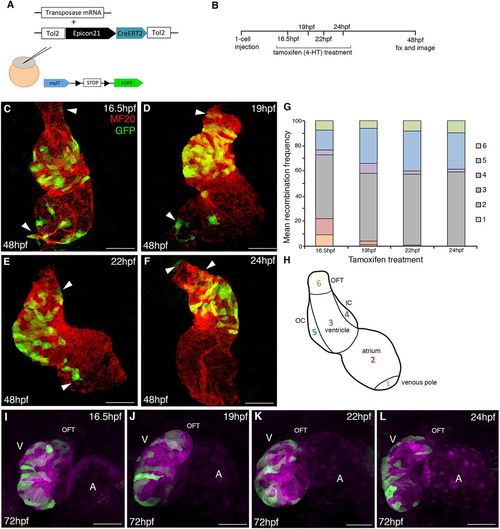
Lineage contribution of hey2+ cells to cardiac development. (A,B) Schematic of the experimental design for lineage tracing of hey2+ cells. (C-F) MF20 and EGFP immunofluorescence staining at 48 hpf showing distribution of Cre-marked cardiomyocytes. Arrowheads indicate labelled cardiomyocytes at the poles of the heart. (G) Bar graph illustrating the contribution of recombined cells to various regions of the heart following 4-HT treatment at 16.5, 19, 22 and 24 hpf (N=3, n=12 at 16.5 hpf; n=6 at 19 hpf; n=16 at 22 hpf; n=14 at 24 hpf). (H) Schematic representation showing the cardiac regions used for recombination analysis. (I-L) Representative images of Tg(epicon21:CreERT2)hsc104×Tg(actb2:RSG) hearts at 72 hpf following 4-HT treatment at 16.5 hpf (I), 19 hpf (J), 22 hpf (K) and 24 hpf (L). Recombined cells are shown in green, with unmarked cells of the heart represented in magenta. A, atrium; V, ventricle; OFT, outflow tract. Scale bars: 50 µm. EXPRESSION / LABELING:
|
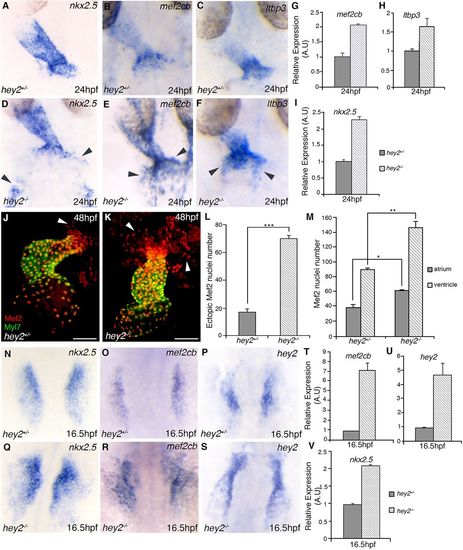
Hey2 negatively regulates the expression of CPC-associated genes. (A-F) WISH staining for SHF markers nkx2.5, mef2cb and ltbp3 at 24 hpf in hey2 heterozygous (A-C) and hey2 mutant (D-F) embryos. (G-I) Quantitative RT-PCR at 24 hpf of mef2cb, ltbp3 and nkx2.5 gene expression. (J,K) Confocal image of Mef2 immunostaining in Tg(myl7:EGFP) hey2 heterozygous (J) and mutant (K) embryos. Arrowheads indicate Mef2+ cells in the arterial pole of the heart. (L,M) Total number of Mef2+ cells in the arterial pole of the heart (L) and in the heart proper (M, with chambers counted separately) in control and hey2 mutant embryos at 48 hpf (N=3, n=4). (N-S) RNA in situ hybridization analysis of expression of nkx2.5, mef2cb and hey2 at 16.5 hpf in hey2 heterozygous (N-P) and mutant (Q-S) embryos. (T-V) Quantitative RT-PCR analysis showing relative expression levels of mef2cb, nkx2.5 and hey2 at 16.5 hpf in hey2 heterozygous and mutant embryos (gene expression normalized to β-actin, fold difference relative to control; N=3, n=3). EXPRESSION / LABELING:
PHENOTYPE:
|
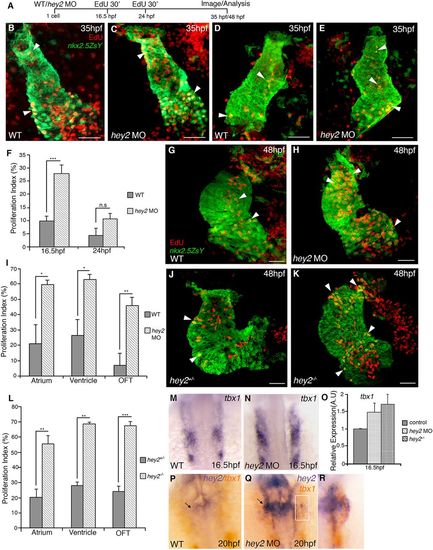
Hey2 inhibits cardiac progenitor cell proliferation during early cardiac development. (A) Schematic of experimental approach for EdU analysis. (B-E) Confocal images of EdU incorporation (red) at 16.5 hpf (B-C) and 24 hpf (D-E) in control (B,D) and hey2 MO (C,E) embryos expressing Tg(nkx2.5:ZsYellow) (green). EdU-positive cardiomyocytes are shown as yellow cells following staining at 35 hpf. (F) Proliferation index at 35 hpf in control and Hey2 morphant embryos following EdU pulse at 16.5 hpf (N=2, n=7) and 24 hpf (N=2, n=4). (G,H) EdU incorporation at 48 hpf in control (G) and hey2 MO (H) embryos following EdU pulse at 16.5 hpf. (I) Proliferation index comparing the number of EdU+ CMs in the atrium, ventricle and OFT between control and hey2 MO embryos at 48 hpf (N=3, n=5). (J,K) EdU incorporation at 48 hpf in hey2 heterozygous (J) and mutant (K) embryos following EdU pulse at 16.5 hpf. (L) Proliferation index comparing the number of EdU+ CMs in the atrium, ventricle and OFT at 48 hpf (N=3, n=14). (M-O) Expression of tbx1 in wild-type (M) and hey2 morphant (N) embryos. Quantitative RT-PCR analysis at 16.5 hpf comparing relative tbx1 expression in control embryos with hey2 morphants and hey2 mutants is shown (O). (P-R) Co-expression of hey2 (blue) and tbx1 (orange) at 20 hpf in control (P) and hey2 morphant (Q, boxed area magnified in R) embryos. Arrowheads highlight EdU+/Nkx2.5+ CMs; arrows indicate hey2+/tbx1+ pharyngeal mesoderm. Scale bars: 20 µm. Data are mean±s.e.m.; *P<0.05; **P>0.01; ***P<0.001. WT, wild type. EXPRESSION / LABELING:
PHENOTYPE:
|
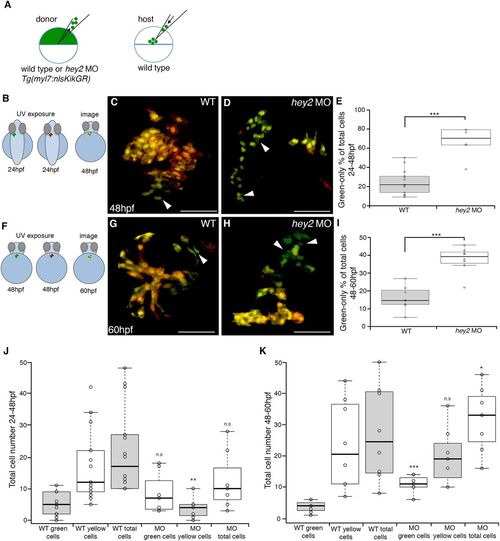
Hey2 functions cell-autonomously to inhibit myocardial contribution to the heart. (A,B,F) Schematic representations of transplantation strategy. (B-D) Following transplantation of Tg(myl7:nlsKiKGR) wild-type (C) and hey2 morphant (D) donors to wild-type hosts, embryos were photoconverted at 24 hpf and imaged at 48 hpf. (E) Boxplot analysis demarking the percentage of donor transplanted CMs that are green-only in control and hey2 MO embryos (n=13, control and n=7, hey2 MO). (F-H) Transplants in which photoconversion was carried out at 48 hpf, followed by imaging at 60 hpf, using wild-type (G) and hey2 MO (H) donors. (I) Boxplot analysis demarking the percentage of green-only transplanted CMs in control and hey2 MO embryos (n=8, control and n=9, hey2 MO). (J,K) Boxplot analysis displaying total numbers of transplant-derived Tg(myl7:nlsKikGR) control and hey2 MO CMs at 24-48 hpf (J; n=12 wild-type green, n=15 wild-type yellow; n=7 hey2 MO green, n=7 hey2 MO yellow) and 48-60 hpf (K; n=8 wild-type green, n=8 wild-type yellow; n=7 hey2 MO green, n=7 hey2 MO yellow). Green cells indicate later (post-photoconversion) contribution, whereas yellow cells indicate pre-photoconversion contribution. Arrowheads indicate green-only (late addition) cardiomyocytes. Data are mean±s.e.m.; *P<0.05, **P<0.01, ***P<0.001; n.s, no significant difference. For box plots, boxes indicate the 25th to 75th percentiles of values, with each data point shown as a dot. Median is shown as a dark line inside the box, while whiskers extend 1.5 times the ineterquartile range from the 25th to 75th percentiles. Scale bars: 50 µm. |
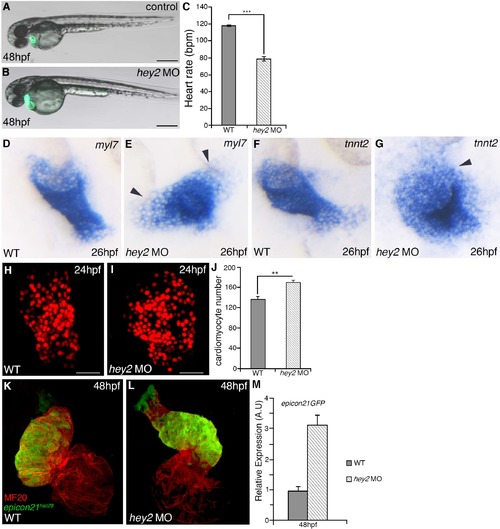
Hey2 morphants phenocopy hey2 mutants (A-B) Bright field images of Tg(myl7:EGFP) in control (A) and hey2 MO (B) embryos at 48 hpf. (C) Heart rate analysis represented as beats per minute (bpm) at 48 hpf in wild type and hey2 morphant embryos. (N=3, n=4). (D-G) RNA in situ hybridization analysis of myl7 (D-E) and tnnt2 (F-G) in control and hey2 MO embryos, respectively. (H-I) Confocal images of cardiomyocyte nuclei in control (H) and hey2 MO (I) Tg(myl7:nlsDsRedExpress) embryos at 24 hpf. (J) Bar graph showing total cardiomyocyte number at 24 hpf in control and hey2 MO embryos (N=3, n=5 per condition). (K-L) Confocal images of Tg(epicon21:EGFP) and MF20 staining at 48 hpf in control (K) and hey2 MO (L) embryos. (M) Quantitative RTPCR analysis of gfp expression (corresponding to Tg(epicon21:EGFP) transcript levels) in control and hey2 MO embryos at 48 hpf. Gene expression normalized to β– actin and fold difference is relative to controls. Black arrowheads indicate cells outside the cardiac tube or cone. Scale bars 50 μm. Error bar mean±s.e.m; ** p<0.01, ***P<0.001. |

Creation of a hey2 transgenic reporter line. (A) Schematic representation of hey2 enhancer (epigenetic conserved region 21) located 24kb upstream of hey2 locus used to create Tg(epicon21:EGFP) . (B-G) Confocal images of Tg(epicon21:EGFP) and Tg(myl7:mCherry-RAS) at 48 hpf (B), 72 hpf (C, D) and 96 hpf (E, G; F with MF20). (H) Schematic methodology of internal epitope tagging of V5 into the hey2 locus with corresponding sequence of tag-specific PCR fragments. (I) Immunofluorescence of Tg(hey2-V5) internal epitope tagging with Tg(myl7:mCherry-RAS) at 30 hpf comparing Hey2 expression (green) with Myl7 (red). Scale bars 50 μm. OFT, outflow tract; V, ventricle and A, atrium; Asterisk indicates atrioventricular canal. Arrowheads mark epicon21+ OFT region (B-F) and ventricular myocardium (G). |
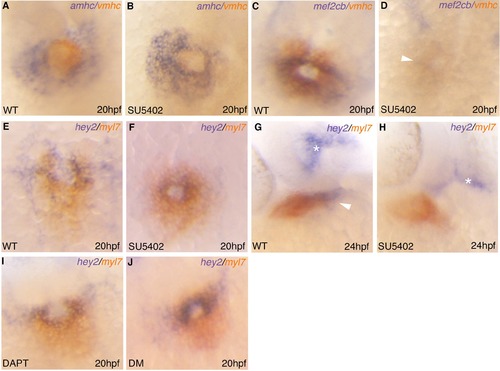
Effects of Fgf, Notch and Bmp inhibition on hey2 expression. (A-J) double RNA in situ hybridization analysis comparing transcript levels of amhc and vmhc (A-B), vmhc and mef2cb (C-D) hey2 and myl7 (E-J) following treatment with either 10 μM SU5402 (A-H), 50 μM DAPT (I) or 10 μM dorsomorphin (J). EXPRESSION / LABELING:
PHENOTYPE:
|

Effect of hey2 knockdown on CPC gene expression. (A-F) RNA in situ hybridization analysis of nkx2.5, ltbp3 and mef2cb gene expression at 24 hpf in WT (A-C) and hey2 MO (D-F) embryos. Note the expanded expression of transcript levels at the poles of the heart tube in morphant embryos (D-F, arrowheads) compared to controls (A-C). Asterisks indicate the heart tube. (G-J) Quantitative RTPCR analysis for mef2cb (G), ltbp3 (H), nkx2.5 (I) and hey2 (J) gene expression between control and hey2 MO embryos at 24 hpf. (K-N) RNA in situ hybridization analysis at 16.5 hpf in control (K, L) and hey2 MO (M, N) embryos for nkx2.5 and mef2cb expression. (O-Q) Quantitative RT-PCR analysis comparing relative expression in control and hey2 morphant embryos for mef2cb (O), nkx2.5 (P) and hey2 (Q) at 16.5 hpf (gene expression is normalized to β–actin, fold difference is relative to controls). (R-U) RNA in situ hybridization analysis at 12 hpf in control (R) and hey2 MO (S) embryos and at 11 hpf (T and U) in hey2 heterozygous (T) and mutant (U) embryos. Dotted line indicates whole embryo outline, arrowheads highlight low levels of nkx2.5 expression in the ALPM of hey2 mutants (U). |