
Fig. S1
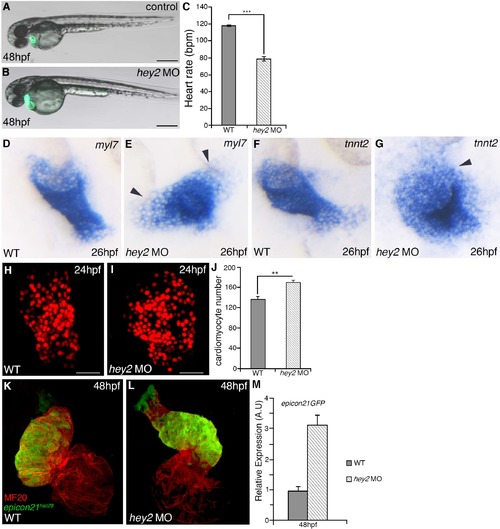
Hey2 morphants phenocopy hey2 mutants (A-B) Bright field images of Tg(myl7:EGFP) in control (A) and hey2 MO (B) embryos at 48 hpf. (C) Heart rate analysis represented as beats per minute (bpm) at 48 hpf in wild type and hey2 morphant embryos. (N=3, n=4). (D-G) RNA in situ hybridization analysis of myl7 (D-E) and tnnt2 (F-G) in control and hey2 MO embryos, respectively. (H-I) Confocal images of cardiomyocyte nuclei in control (H) and hey2 MO (I) Tg(myl7:nlsDsRedExpress) embryos at 24 hpf. (J) Bar graph showing total cardiomyocyte number at 24 hpf in control and hey2 MO embryos (N=3, n=5 per condition). (K-L) Confocal images of Tg(epicon21:EGFP) and MF20 staining at 48 hpf in control (K) and hey2 MO (L) embryos. (M) Quantitative RTPCR analysis of gfp expression (corresponding to Tg(epicon21:EGFP) transcript levels) in control and hey2 MO embryos at 48 hpf. Gene expression normalized to β– actin and fold difference is relative to controls. Black arrowheads indicate cells outside the cardiac tube or cone. Scale bars 50 μm. Error bar mean±s.e.m; ** p<0.01, ***P<0.001. |