
- Title
-
Cilia Control Vascular Mural Cell Recruitment in Vertebrates
- Authors
- Chen, X., Gays, D., Milia, C., Santoro, M.M.
- Source
- Full text @ Cell Rep.

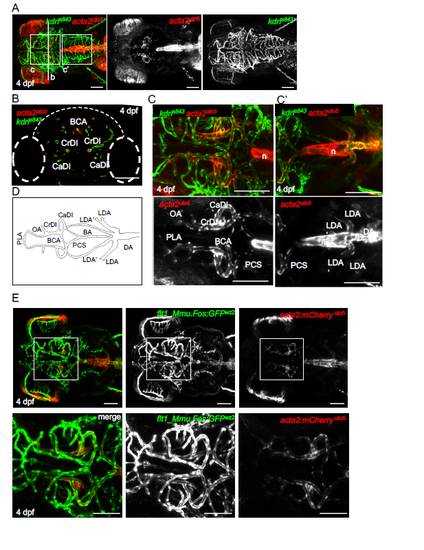
Zebrafish vMCs Are Recruited around Arterial-Fated Vessels of Developing Vasculature (A) DA, but not PCV, is covered by vMCs (red, arrow). Partial z-projection of the trunk region (somite 8?14) of a Tg(kdrl:egfp)s843; Tg(acta2:mCherry)uto5 embryo at 3 dpf. Merged and single channels are shown. mCherry expression is also detected in the lateral line (arrowhead) and floor plate (star). Scale bar, 100 ?m. (B) Confocal transverse sections of the DA of Tg embryos of the indicated genotype. Both Tg(acta2:mCherry)uto5 and Tg(tagln:CAAX-egfp)uto37 lines mark vMCs located in the ventral side of the DA (arrow). Blue, nuclei. Scale bar, 25 ?m. (C) vMCs are recruited only by segmental arteries. At 4 and 5 dpf, vMCs progressively cover SeAs but not SeVs (arrows). The graph shows the percentage of SeAs covered by vMCs in the trunk. By 5 dpf, supraintestinal arteries (SIAs) are also covered by vMCs (yellow arrows). Data are represented as mean � SD. Scale bar, 50 ?m. (D) Confocal transverse sections of the trunk region of Tg(kdrl:egfp)s843 embryos stained for Tagln (red). vMCs are located only around SeAs but not SeVs. Blue, nuclei. Scale bar, 25 ?m. (E) Quantification of vMC coverage in arterial and venous zebrafish vessels. Double Tg Tg(flt1:Mmu.Fos-EGFP)wz2;Tg(?5.2lyve1b:DsRed)nz101 zebrafish embryos expressing EGFP in arteries and dsRed2 in veins (Nicenboim et al., 2015) were stained with the vMC marker Tagln (gray) of 4 dpf. A total number of five z-stacks for 10 embryos were analyzed. Histograms show the percentage of vessels covered by vMCs compared to the total number counted for each category. No vMCs were found around veins in all experimental conditions. Data are represented as mean � SD. (F) vMCs are located only around arterial endothelial cells (arrows). Partial z-projection of the trunk region (somite 8?14) of Tg(acta2:mCherry)uto5; Tg(tp1:egfp)um14. Merged and single confocal channels are shown. Scale bar, 100 ?m. (G) Confocal transverse sections of the trunk region of Tg(tp1:egfp)um14 stained for Tagln (red). vMCs are positioned only around tp1-positive SeA vessels (arrows). Blue, nuclei. Scale bar, 25 ?m. See also Figures S1 and S2. EXPRESSION / LABELING:
|
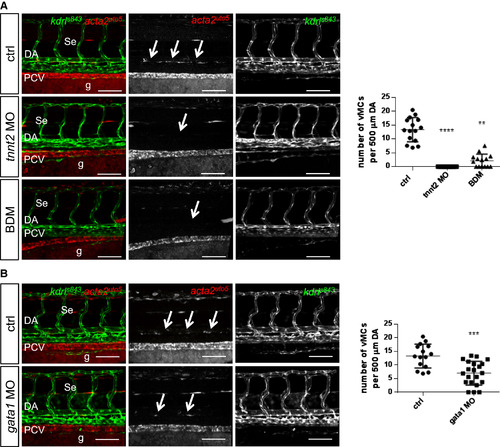
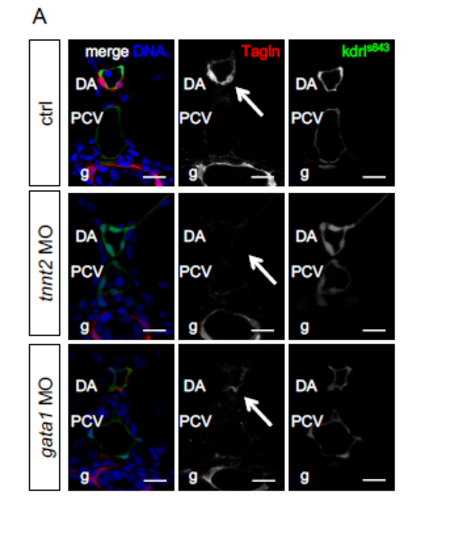
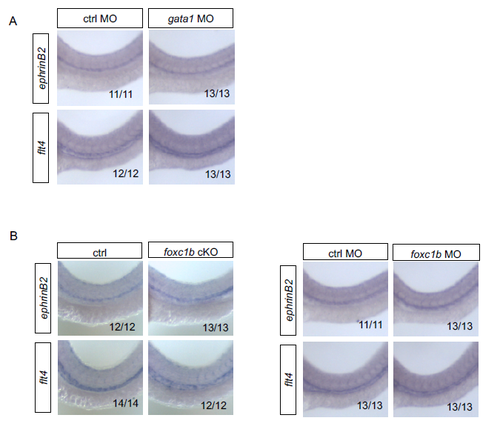
Blood Flow and Hemodynamic Forces Regulate vMC Recruitment (A) Genetic and pharmacological impairment of blood flow prevent vMC recruitment. Confocal images of partial z-projections of the trunk region (somite 8?14) of Tg(kdrl:egfp)s843;Tg(acta2:mCherry)uto5 embryos at 3 dpf (merged and single channels) after injection of tnnt2 morpholinos or 2,3-BDM treatment. Compared to controls, vMCs (arrows) are not recruited around the DA of embryos with impaired blood flow. Scatter plots show the quantification of vMC number per 500 ?m of the DA at 80 hpf. n = 15, 26, and 15 embryos, respectively. Data are represented as mean � SD. Stars represent the results of one-way ANOVA-Dunnett?s post hoc test (?p < 0.05, ??p < 0.01, ???p < 0.001, ????p < 0.0001). g, gut. (B) Abrogation of erythrocytes and reduced shear stress impair vMC coverage. Confocal images of partial z-projections of the trunk region (somite 8?14) of Tg(kdrl:egfp)s843;Tg(acta2:mCherry)uto5 embryos at 3 dpf (merged and single channels) after gata1 knockdown by morpholino injection. Compared to controls, gata1 morphants showed reduced vMCs around the DA (arrows). Scatter plots show the quantification of vMC number per 500 ?m of the DA at 80 hpf. n = 15 and 23 embryos, respectively. Data are represented as mean � SD. Stars represent the results of unpaired t tests of mean difference = 0 (?p < 0.05, ??p < 0.01, ???p < 0.001). See also Figure S3. EXPRESSION / LABELING:
PHENOTYPE:
|

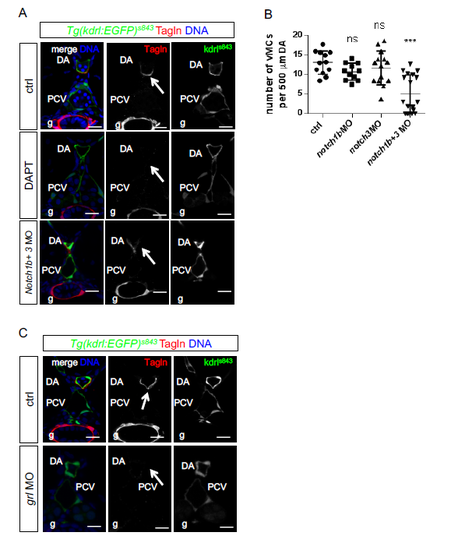
Notch Activation Is Required for Arterial vMC Recruitment (A) Pharmacological and genetic inhibition of Notch signaling reduces vMC recruitment around the DA. Confocal images of partial z-projections of the trunk region (somite 8?14) of Tg(kdrl:egfp)s843Tg(acta2:mCherry)uto5 embryos at 80 hpf (merged and single channels) treated with DAPT or co-injected with notch1b and notch3 morpholinos. Scatter plots show the number of vMCs counted along 500 ?m of the DA at 80 hpf. n = 27, 29, and 19 embryos. Data are represented as mean � SD. Stars represent the results of one-way ANOVA-Dunnett?s post hoc test (?p < 0.05, ??p < 0.01, ???p < 0.001, ????p < 0.0001). g, gut. (B) Hey2/grl is required for vMC recruitment. Confocal images of partial z-projections of the trunk region (somite 8?14) of Tg(kdrl:egfp)s843;Tg(acta2:mCherry)uto5 embryos at 80 hpf (merged and single channels) after grl knockdown by morpholinos injection. Compared to controls, grl morphants lack vMC coverage around the DA (arrows). Scatter plots show the quantification of vMC number per 500 ?m of the DA at 3 dpf. n = 23 and 17 embryos. Data are represented as mean � SD. Stars represent the results of unpaired t tests of mean difference = 0 (?p < 0.05, ??p < 0.01, ???p < 0.001, ????p < 0.0001). See also Figure S4. EXPRESSION / LABELING:
PHENOTYPE:
|

Notch Signaling Acts Downstream of Blood Flow to Recruit vMCs (A) Shear-stress-mediated Notch activation in arterial-fated endothelial cells. Western blot analyses show increased levels of cleaved intracellular Notch (NICD) after 4 hr of LSS, whereas total Notch1 is unchanged. ?-actin has been used as loading control. Histograms show the quantification of the amount of cleaved Notch1 (NICD)/over total Notch1 upon shear stress in endothelial cells. (B) Shear stress induces Notch signaling in ECs. Effects of shear stress on the expression of different Notch target genes in human endothelial cell lines after 24 hr of LSS. ???p < 0.001, ????p < 0.0001. Data are represented as mean � SD. Stars represent the results of two-way ANOVA. (C) Loss of Notch signaling by blockade of blood flow in living zebrafish vessels. qPCR analyses of different Notch target genes are downregulated in ECs sorted from Tg(kdrl:egfp)s843 injected with control or gata1 MO at 48 hpf. ???p < 0.001; ????p < 0.0001. Data are represented as mean � SD. Stars represent the results of two-way ANOVA. (D) Arterial Notch activation restores vMC recruitment in the absence of blood flow in zebrafish vessels. Confocal images of Tagln staining (green) on section of TgBAC(dll4:GAL4FF;UAS:RFP)hu10049Tg(UAS:NICD)kca3 injected with tnnt2 or control morpholino. Expression of NICD in arterial ECs (dll4:RFP) rescue vMC recruitment (arrow) in the absence of blood flow (gata1 morphants). All the embryos analyzed (n = 15 in both conditions) show the indicated phenotype. Blue, nuclei. Scale bar, 25 ?m. (E) Blood flow can promote Notch signaling and vMC coverage in arterial vessels in the absence of dll4. Injection of dll4 morpholino induces a reduction of EGFP-positive Se vessels in Tg(tp1:egfp)um14 embryos. The few Se vessels that are positive for Notch activity and vMC coverage are the ones with circulation (arrow). A total number of 23 controls and 30 morphants were analyzed. Scale bar, 50 ?m. (F) Notch signaling is impaired after dll4 inactivation (KD). Histograms show the percentage of tp1:GFP+ Se vessels in 500 ?m of DA, which are reduced in dll4 MO (n = 22/155 Se) compared to controls (n = 85/128 Se). The coverage of tp1+ vessels by vMCs is not altered in dll4 MO (n = 9/22) compared to controls (55/85), showing that flow can still recruit vMCs. A total number of 23 controls and 30 morphants were analyzed. Data are represented as mean � SD. Stars represent the results of unpaired t tests of mean difference = 0 (?p < 0.05, ??p < 0.01, ???p < 0.001). Arrows indicate vessels with blood flow in dll4 morphants. See also Figures S5 and S6. EXPRESSION / LABELING:
PHENOTYPE:
|
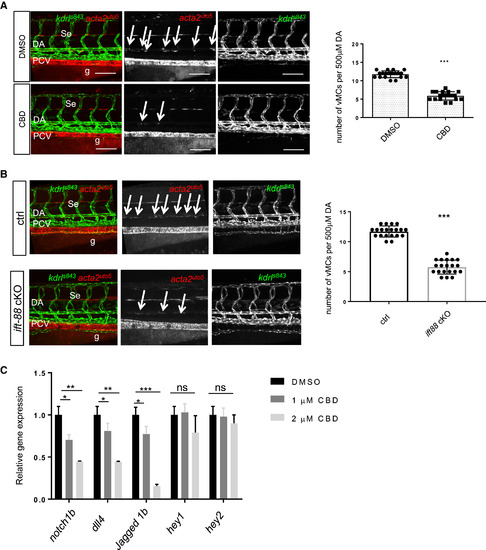
Cilia Are Required to Drive vMC Recruitment (A) Pharmacological impairment of primary cilia formation negatively regulates vMC recruitment. Confocal images of partial z-projections of the trunk region (somite 8?14) of Tg(kdrl:egfp)s843;Tg(acta2:mCherry)uto5 embryos at 80 hpf (merged and single channels) after disrupting cilia formation by CBD treatment. Compared to controls, CBD-treated embryos show reduced vMC coverage around the DA (arrows). Scatter plots show the quantification of vMC number per 500 ?m of the DA at 80 hpf. n = 39 and 53 embryos. Data are represented as mean � SD. Stars represent the results of unpaired t tests of mean difference = 0 (?p < 0.05, ??p < 0.01, ???p < 0.001, ????p < 0.0001). g, gut. (B) Endothelial-specific genetic inhibition of ift88 gene expression impairs vMC coverage. Confocal images of partial z-projections of the trunk region (somite 8?14) of Tg(kdrl:egfp)s843Tg(acta2:mCherry)uto5 embryos at 80 hpf (merged and single channels) injected with the integratable CRISPR vector for endothelial-specific ift88 gene targeting. Cmlc2:GFP-negative embryos were used a negative control (ctrl). Scatter plots show the quantification of vMC number per 500 ?m of the DA at 80 hpf. n = 20 and 20 embryos. Data are represented as mean � SD. Stars represent the results of unpaired t tests of mean difference = 0 (?p < 0.05, ??p < 0.01, ???p < 0.001, ????p < 0.0001). (C) Inhibition of cilia function by CBD treatment impairs Notch signaling in living zebrafish blood vessels. qPCR analysis of Notch target genes in DMSO and 1 and 2 ?M CBD-treated embryos. qPCR analysis of Notch target gene expression in zebrafish treated with different concentrations of CBD at 48 hpf. A zebrafish trunk was used for RNA extraction and qPCR analyses. Notch1b, dll4, and Jagged1b are the most affected Notch targets by the lack of cilia at this stage of development (48 hpf). Data are represented as mean � SD. Stars represent the results of two-way ANOVA. ?p < 0.05, ??p < 0.01, ???p < 0.001. See also Figures S7?S10. EXPRESSION / LABELING:
PHENOTYPE:
|
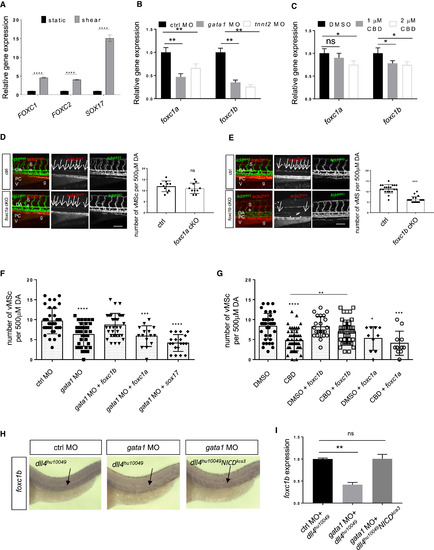
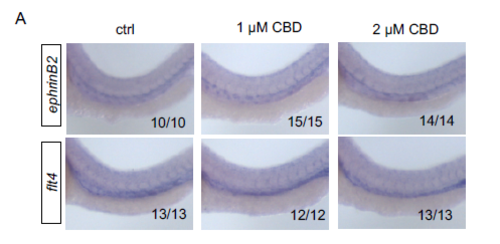
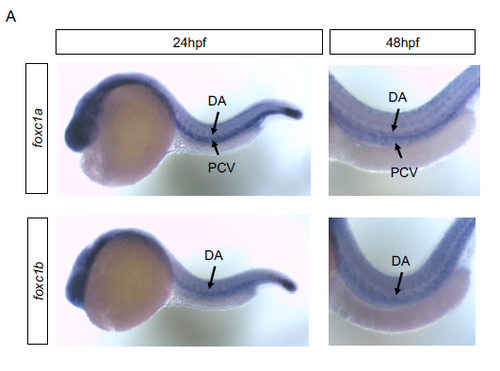
foxc1b Required Downstream Cilia and Notch Signaling to Recruit vMCs around Developing Vasculature (A) Shear stress modulates expression of FOXC1 and FOXC2. Arterial endothelial cells exposed to 24 hr of LSS show increased expression of FOXC1, FOXC2, and SOX17 genes. Data are represented as mean � SD. Stars represent the results of one-way ANOVA. ????p < 0.00011. (B) Blockade of shear stress in zebrafish inhibits foxc1a and foxc1b gene expression. qPCR analysis of foxc1a and foxc1b gene expression in zebrafish injected with control MO, gata1 MO, and tnnt2 MO. Foxc1b is more affected by the lack of flow compared to foxc1a. Data are represented as mean � SD. Stars represent the results of two-way ANOVA. ??p < 0.01. (C) Primary cilia impairment inhibits zebrafish foxc1a and foxc1b gene expression. qPCR analysis of foxc1a and foxc1b gene expression in zebrafish control and 1 or 2 ?M CBD-treated embryos at 48 hpf. The trunk of treated embryos was used for RNA extraction and qPCR analyses. Foxc1b is more affected by the lack of cilia compared to foxc1a. Data are represented as mean � SD. Stars represent the results of two-way ANOVA. ?p < 0.1. (D) Endothelial-cell-specific foxc1a inhibition reduces vMC recruitment around the DA. Confocal images of partial z-projections of the trunk region (somite 8?14) of Tg(kdrl:egfp)s843;Tg(acta2:mCherry)uto5 embryos at 80 hpf (merged and single channels) injected with endothelial-cell-specific foxc1a cKO plasmid together with Tol2 mRNA. Cmlc2-negative embryos were used a control (ctrl). Asterisks indicate acta2-positive somites in cmlc2:GFP-positive embryos. n = 10 and 10 embryos. Right: scatter plots show the number of vMCs counted along 500 ?m of the DA. ns indicates no significant difference in a one-way ANOVA test. Data are represented as mean � SD. (E) Endothelial-cell-specific foxc1b inhibition reduces vMC recruitment around the DA. Confocal images of partial z-projections of the trunk region (somite 8?14) of Tg(kdrl:egfp)s843Tg(acta2:mCherry)uto5 embryos at 80 hpf (merged and single channels) injected with endothelial-cell-specific foxc1b cKO plasmid together with Tol2 mRNA. Cmlc2:GFP-negative embryos were used as control (ctrl); n = 20 and 20 embryos. Right: scatter plots show the number of vMCs counted along 500 ?m of the DA. Data are represented as mean � SD. Stars represent the results of two-way ANOVA. ???p < 0.001. (F) Foxc1b, but not foxc1a or sox17, expression restores vMC recruitment in absence erythrocytes and reduced shear stress in zebrafish vessels. Scatter plots show the quantification of vMC number per 500 ?m of the DA obtained from confocal images of partial z-projections of the trunk region (somite 8?14) of Tg(kdrl:egfp)s843Tg(acta2:mCherry)uto5 embryos at 80 hpf after gata1 morpholino injection alone or with mRNA of foxc1b, foxc1a, or sox17, respectively. Compared to gata1 morphants, coinjection of foxc1b showed restored vMC recruitment around the DA. n = 34, 35, 34, 15, and 19 embryos, respectively. Data are represented as mean � SD. Stars represent the results of one-way ANOVA-Dunnett?s post hoc test. ?p < 0.05, ??p < 0.01, ???p < 0.001, ????p < 0.0001. (G) vMC recruitment is rescued by expression of foxc1b in a zebrafish embryo chemically inhibited for cilia formation. Scatter plots show the quantification of vMC number per 500 ?m of the DA obtained from confocal images of partial z-projections of the trunk region (somite 8?14) of Tg(kdrl:egfp)s843Tg(acta2:mCherry)uto5 embryos at 80 hpf. After injection of the mRNA of foxc1b, foxc1a, or sox17 at one single-cell stage, embryos were again injected in the pericardium with CBD or DMSO at 54 hpf. Only embryos carrying exogenous foxc1b expression showed restored vMC recruitment around the DA after cilia impairment. n = 40, 52, 21, 41, 9, and 10 embryos, respectively. Data are represented as mean � SD. Stars represent the results of one-way ANOVA-Dunnett?s post hoc test (?p < 0.05, ??p < 0.01, ???p < 0.001, ????p < 0.0001). (H) foxc1b expression is downstream of Notch signaling. Representative images of whole-mount in situ hybridization of foxc1b gene in zebrafish Tg(dll4:Gal4;UAS:mCherry;UAS:NICD) embryos at 48 hpf injected with control or gata1 morpholino. Arrows show specific foxc1b expression. Ten embryos for each condition were analyzed, and all of them showed the specific phenotype. (I) Arterial Notch activation (NICD) rescues flow-dependent impairment of foxc1b expression. qPCR analysis of foxc1b gene expression in zebrafish Tg(dll4:Gal4;UAS:mCherry;UAS:NICD) embryos at 48 hpf injected with control or gata1 morpholino. Reduced foxc1b expression in gata1 morphants is fully rescued by arterial NICD expression. Data are represented as mean � SD. Stars represent the results of one-way ANOVA-Dunnett?s post hoc test (??p < 0.01). See also Figures S11?S13.. EXPRESSION / LABELING:
PHENOTYPE:
|

|
|
|
|

|

|

|
|
|
|