
- Title
-
Phylogenetic analysis and expression of zebrafish transient receptor potential melastatin family genes
- Authors
- Kastenhuber, E., Gesemann, M., Mickoleit, M., and Neuhauss, S.C.
- Source
- Full text @ Dev. Dyn.

Expression of trpm1a and trpm1b, shown in whole-mount during zebrafish development. A–K: trpm1a expression. A–C: Lateral (A,C) and dorsal (B) views of embryos 24 hpf, of which C shows dorsal and lateral NC cells of the tail in higher magnification. D–F: Dorsal (D,E) and lateral (F) views of embryos staged 48 hpf. G,H: The 3 dpf larvae shown from the ventral side. J,K: Ventral (J) and lateral (K) views of larvae staged 5 dpf. L–R: trpm1b expression with L: dorsal view of embryos 24 hpf. M,N: Embryos staged 48 hpf shown from the dorsal side. O,P: Ventral (O) and lateral (P) views of larvae 3 dpf. Q,R: Ventral (Q) and lateral (R) views of larvae 5 dpf. Zebrafish are orientated with anterior to the left in all pictures but G, J, O, and Q, where anterior is to the top. Scale bars of 100 μm are indicated in the first picture of a series until changed. Scale bar in C = 25 μm. NC, neural crest; Mel, melanoblast/-cyte; CMZ, ciliary marginal zone; INL, inner nuclear layer; RPE, retinal pigment epithelium; CF, choroid fissure. |
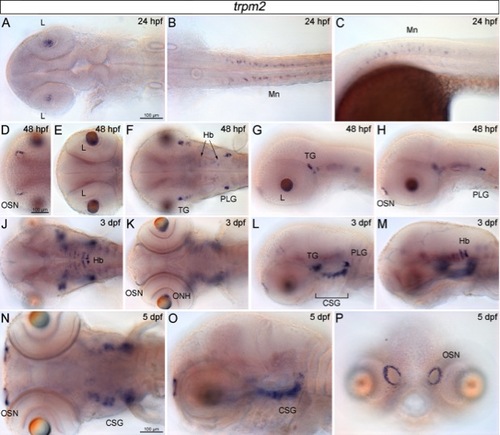
Dynamic expression pattern of trpm2 during zebrafish development, shown in whole-mount views. A–C: Dorsal (A,B) and lateral (C) views of embryos 24 hours post fertilization (hpf). D–H: Ventral (D–F) and lateral (G,H) views of embryos staged 48 hpf. J–M: The 3 days post fertilization (dpf) larvae shown from the dorsal (J), ventral (K), and lateral (L,M) side, respectively. N–P: Ventral (N), lateral (O), and frontal (P) views of larvae staged 5 dpf. Orientation of zebrafish is with anterior to the left in all pictures but P showing a frontal view. Scale bars of 100 μm are indicated in the first picture of a series until changed. L, lens; Mn, motoneurons; OSN, olfactory sensory neurons; TG, trigeminal ganglia; PLG, posterior lateral line ganglia; Hb, hindbrain; ONH, optic nerve head; CSG, cranial sensory ganglia. |
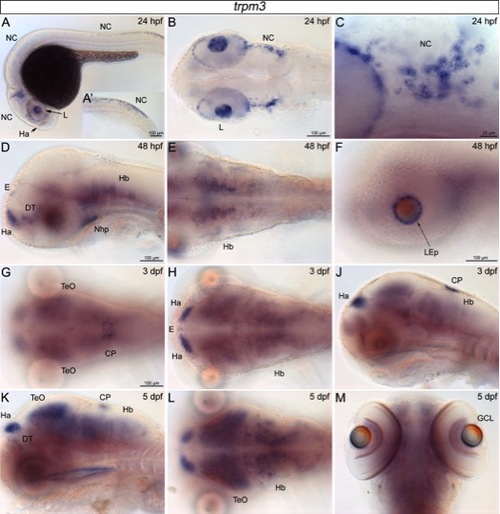
Expression of trpm3 in whole-mount zebrafish during embryonic and larval stages. A–C: Lateral (A, A′,C) and dorsal (B) views of embryos 24 hours post fertilization (hpf) with (A′) showing staining in NC cells of the tail and (C) providing a higher magnification of trpm3 expression in cranial NC cells. D–F: Lateral (D, F) and dorsal (E) views of embryos staged 48 hpf. G–J: The 3 days post fertilization (dpf) larvae shown from the dorsal (G,H) and lateral (J) side, respectively. K–M: Lateral (K), dorsal (L), and ventral (M) views of larvae staged 5 dpf. Zebrafish are orientated with anterior to the left in all pictures but M, where anterior is to the top. Scale bars of 100 μm are indicated in the first picture of a series until changed. Scale bar in C refers to 25 μm. NC, neural crest; Ha, habenula; E, epiphysis; DT, dorsal thalamus; Nhp, neurohypophysis; Hb, hindbrain; LEp, lens epithelium; TeO, optic tectum; CP, choroid plexus; GCL, ganglion cell layer. |
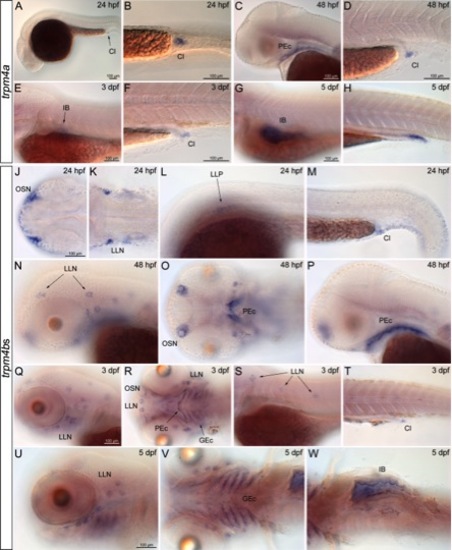
Expression of trpm4 channel genes, trpm4a and trpm4b1, shown in whole-mount during zebrafish development. Expression pattern of both, trpm4b2 and trpm4b3 are identical to trpm4b1. A–K: trpm4a expression. A,B: Lateral (A) and ventral (B) views of embryos 24 hours post fertilization (hpf). C,D: Lateral views of embryos staged 48 hpf. E,F: The 3 days post fertilization (dpf) larvae shown laterally. G,H: Lateral views of larvae staged 5 dpf. J–W: Expression of trpm4bs. J–M: Dorsal (J,K) and lateral (L,M) views of embryos 24 hpf. N–P: Embryos staged 48 hpf shown from the lateral (N,P) and ventral (O) side. Q–T: Lateral (Q,S,T) and ventral (R) views of larvae 3 dpf. U–W: Lateral (U) and ventral (V,W) views of larvae 5 dpf. Zebrafish are orientated with anterior to the left. Scale bars of 100 μm are indicated in the first picture of a series until changed. Cl, cloaca; PEc, pharynx ectoderm; IB, intestinal bulb; OSN, olfactory sensory neurons; LLN, lateral line neuromast; LLP, lateral line primordium; GEc, gill ectoderm. |
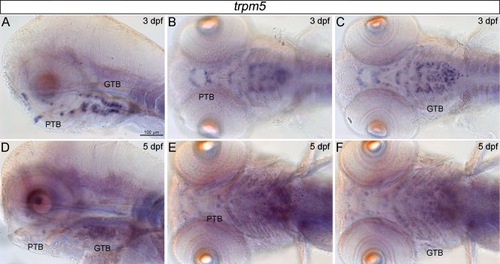
Expression of trpm5 in taste bud cells during zebrafish development. A–C: Lateral (A) and ventral (B,C) whole-mount views of larvae 3 days post fertilization (dpf). D–F: Lateral (D) and ventral (E,F) whole-mount views of larvae staged 5 dpf, with anterior to the left in all pictures. Scale bars of 100 μm are indicated in A for all pictures shown. PTB, pharynx taste bud; GTB, gill taste bud. EXPRESSION / LABELING:
|
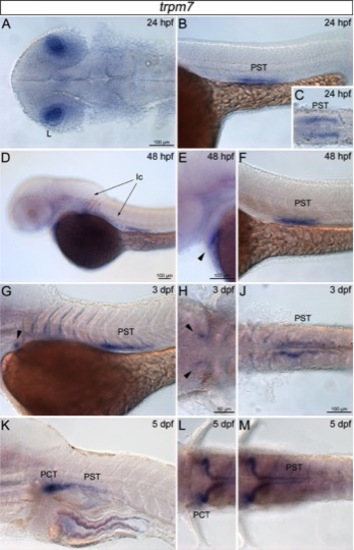
Expression of trpm7 in whole-mount zebrafish during embryonic and larval stages. A–C: Dorsal (A), lateral (B), and ventral (C) views of embryos 24 hours post fertilization (hpf). D–F: Lateral views of embryos staged 48 hpf. G–J: The 3 days post fertilization (dpf) larvae shown from lateral (G) and ventral (H–J) sides, respectively. K–M: Lateral (K) and ventral (L,M) views of larvae staged 5 dpf. Zebrafish are orientated with anterior to the left. Arrowheads in E, G, and H mark expression domains in unspecified anatomical structures. Scale bars of 100 μm are indicated in the first picture of a series until changed, but scale bar in H refers to 50 μm. L, lens; PST, proximal straight tubule; Ic, ionocyte; PCT, proximal convoluted tubule. |

Unillustrated author statements |