
- Title
-
High-speed imaging of developing heart valves reveals interplay of morphogenesis and function
- Authors
- Scherz, P.J., Huisken, J., Sahai-Hernandez, P., and Stainier, D.Y.
- Source
- Full text @ Development
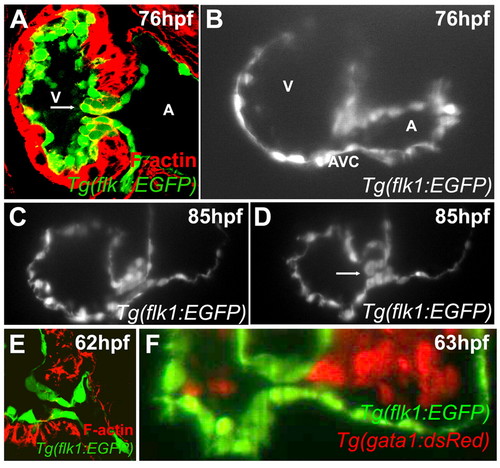
Zebrafish valves form through invagination. Larvae were stained with rhodamine-phalloidin and imaged using confocal microscopy at 76 (A) or 62 (E) hpf, or imaged using SPIM at 76 (B), 85 (C,D) or 63 (F) hpf. Although by confocal microscopy a superior endocardial cushion appears to be present (panel A), SPIM imaging shows that this structure is actually a valve leaflet (B-D). Arrow in panel A points to the presumed endocardial cushion and that in D to the valve leaflet. No intermediate stage of mesenchymal cells was observed by either confocal (E) or SPIM imaging (F). A, atrium; V, ventricle. |
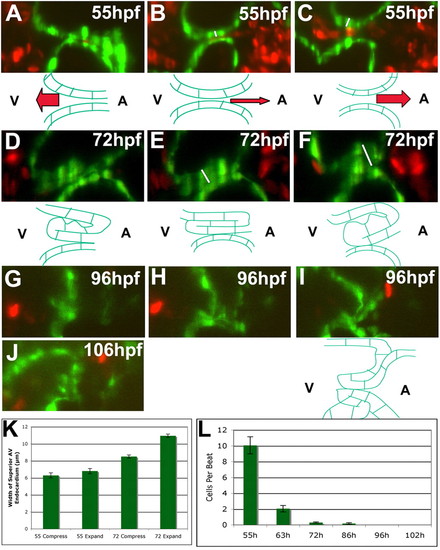
Zebrafish AVV function becomes more efficient during development. Embryos and larvae were imaged using SPIM at 55 (A-C), 72 (D-F), 96 (G-I), and 106 (J) hpf. In 55 and 72 hpf animals, the thickness of the valves at the point of highest compression (i.e. white lines in B and E) and greatest expansion (i.e. white lines in C and F) was measured and the 95% confidence interval calculated (K). The number of cells flowing retrogradely across the AVC during valve function was counted for all stages along with the 95% confidence interval (L). (A-C) At 55 hpf, the AVC closes by the action of myocardial contractions (A), rolls atrially to ventricularly (B), and finally relaxes (C). The endocardium cannot occlude the lumen in these last two phases, leading to retrograde blood flow (B,C,L). (D-F) This three-part movement of the valve is repeated at 72 hpf, but a thick invaginating valve leaflet occludes the lumen during the roll and relaxation (E,F) through its compression and expansion (K). (G,H) The same three-part movement is found at 96 hpf, but the valve leaflet hangs down to occlude the lumen during relaxation (I). (J) By 106 hpf, both a superior and inferior valve leaflet are present. Drawings underneath the frames of the 55, 72 and last frame of the 96 hpf movies illustrate the shape of the AVC endocardial tissue in these pictures. |
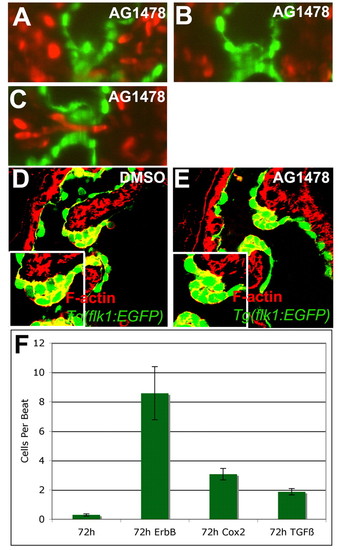
Inhibiting ErbB signaling disrupted the rolling of the valve. Zebrafish embryos were treated with 4 μM AG1478, an ErbB receptor inhibitor, or 1% DMSO from 56-72 hpf and imaged with SPIM (A-C) or stained with rhodamine-phalloidin and imaged with confocal microscopy (D,E). Retrograde flow of blood cells per beat was quantified for animals treated with 1% DMSO, 4 μM AG1478, 25 μM CAY10404 or 3 μM SB431542 along with the 95% confidence interval (F). (A-C) Inhibition of ErbB signaling led to altered valve function, with the valve coming together on the ventricular side of the AVC (A), rolling ventricularly to atrially (B), and coming apart during the relaxation phase allowing retrograde blood flow (C,F). Larvae treated with inhibitor showed malformed valves with incomplete invagination and increased space between the two sides of the valve leaflet (E). |
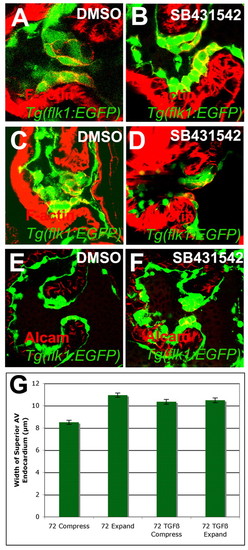
Inhibition of TGFβ signaling disrupted the shape of invaginating valve cells. (A-G) Zebrafish embryos were treated with 1% DMSO (A,C,E) or 3 μM SB431542 (B,D,F) from either 56-72 (A,B,E,F) or 56-96 (C,D) hpf, and stained with rhodamine-phalloidin (A-D) or for Alcam (E,F) and imaged by confocal microscopy (A-F) or SPIM (G). The thickness of the valve at the point of greatest compression or expansion was measured and compared along with the 95% confidence interval (G). (A-D) Inhibition of TGFβ signaling resulted in cuboidal invaginating cells (B,D) compared with control valves (A,C). (E,F) TGFβ signaling was required for the downregulation of Alcam in the invaginating cells. (G) This change in shape and adhesion resulted in the inability of the valves to compress and expand. |
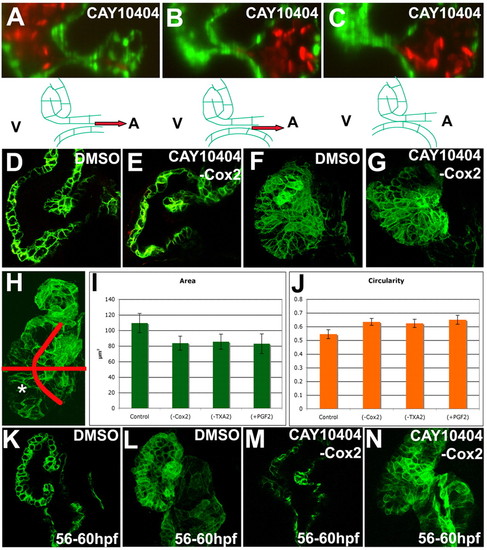
Inhibition of Cox2 and prostaglandin signaling altered myocardial cell shape. Zebrafish embryos were treated with 25 μM CAY10404 (A-C,E,G,M,N), a Cox2 inhibitor, or 1% DMSO (D,F,K,L) from 56-72 (A-C,D-G) or 56-60 (K-N) hpf, imaged using SPIM (A-C) or confocal microscopy (D-G,K-N) and projections made (F,G,L,N). The area (I) and circularity (J) of cells in the posterior outer curvature of the ventricle was measured and the 95% confidence interval calculated. (A-C) Inhibition of Cox2 caused the invaginating cells to be translated towards the ventricle, such that the AVC closed (A) and rolled (B) on an endocardial monolayer leading to retrograde blood flow (B). (D,E) The invaginating cells shifted towards the ventricle because the myocardium overlying the superior AVC bent towards the ventricle (E). (F,G) This bending correlates with changes in ventricular shape caused by decreases in cell area (G,I) and increases in cell circularity (G,J). (H) The ventricle was divided into four areas based on anterior or posterior, outer or inner curvature, for the cell shape and circularity analysis. Significant differences were found in the posterior outer curvature of the ventricle, indicated with an asterisk. Myocardial bending (M) and cell shape changes (N) arose within 4 hours of treatment with Cox2 inhibitor. |
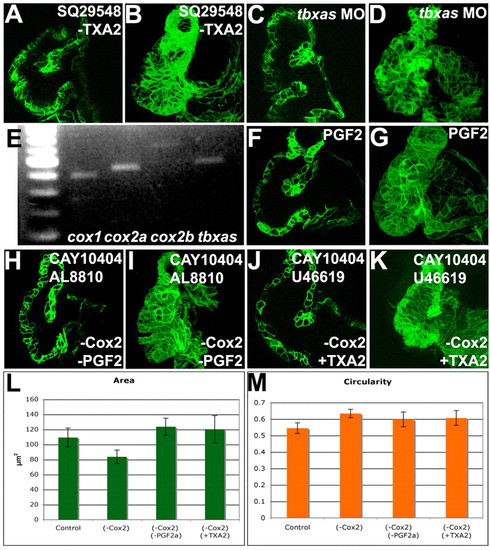
Activation of TXA2 signaling or inhibition of PGF2αrescued the Cox2 inhibition phenotype. Zebrafish embryos were treated with 10 μM SQ29548 (A,B), a TP receptor inhibitor, 25 μM CAY10404 and 5 μM AL8810 (H,I), an FP receptor inhibitor, 25 μM CAY10404 and 10 μM U46619 (J,K), a TP receptor agonist, or injected with tbxas morpholinos (C,D), imaged with confocal microscopy (A-D,F-K), projections made (B,D,G,I,K) and the area (L) and circularity (M) measured and the 95% confidence interval calculated. Myocardial bending (A,C,F) and cell shape changes (B,D,G) were observed in larvae in which TXA2 signaling was inhibited (A-D) or PGF2α signaling was increased (F,G). (E) RT-PCR was performed on RNA from isolated hearts for cox1, cox2a, cox2b and tbxas. cox1, cox2a, cox2b and tbxas are expressed in the heart. (H-M) Inhibition of PGF2α signaling (H,I) or activation of TXA2 signaling (J,K) rescued the Cox2 inhibition phenotypes of myocardial bending (H,J) and the decrease in myocardial cell area (I,K,L), but not the increase in myocardial circularity (M). |
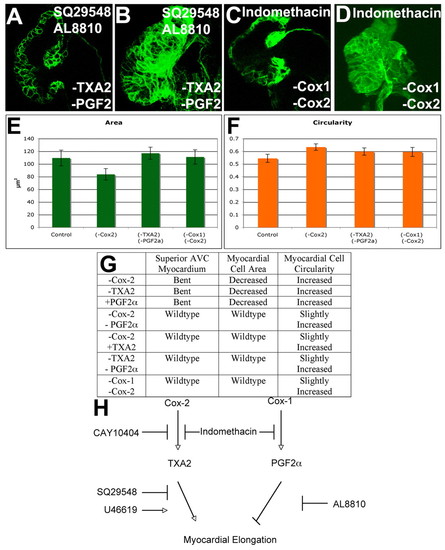
A balance of TXA2 and PGF2α signaling regulates myocardial cell shape. Zebrafish embryos were treated with 10 μM SQ29548 and 5 μM AL8810 (A,B), or 15 μM indomethacin (C,D), an inhibitor of Cox1 and Cox2, imaged with confocal (A-D), projections made (B,D) and the area (E) and circularity (F) measured and the 95% confidence interval calculated. Inhibition of both PGF2α and TXA2 signaling (A,B) or all Cox signaling (C,D) gave wild-type shape of the myocardium overlying the AVC (A,C) and wild-type myocardial area (B,D,E), although myocardial circularity was increased (F). (G) Table of the effects of inhibiting or activating different signaling pathways. (H) These findings suggest a model in which Cox2-derived TXA2 supports myocardial elongation, whereas PGF2α arising from Cox1 action or from the action of both Cox1 and Cox2 inhibits myocardial elongation. |

Injection of tbxas MO leads to pericardial edema. At 72 hpf, larvae that had been injected with 2 ng of tbxas MO had pericardial edema (B), whereas uninjected controls did not (A). PHENOTYPE:
|

Unillustrated author statements PHENOTYPE:
|