
- Title
-
The zebrafish onecut gene hnf-6 functions in an evolutionarily conserved genetic pathway that regulates vertebrate biliary development
- Authors
- Matthews, R.P., Lorent, K., Russo, P., and Pack, M.
- Source
- Full text @ Dev. Biol.

Zebrafish hnf-6 expression. (A) Rostral view of 24 hpf embryo showing hnf-6 expression in the retina (large arrow), forebrain (arrowhead), and midbrain (small arrow). (B) Dorsal view of 48 hpf larva showing expression in the liver (arrowhead) and fin buds (arrows). (C) Cross section of 48 hpf larva in the region of the liver showing diffuse low-level expression in the liver (arrowhead) and fin buds (arrow). (D) Dorsal view of 72 hpf larva showing hnf-6 expression in the liver (black arrowhead) and pancreas (white arrowhead). (E) Cross section of 72 hpf larva showing hnf-6 expression in the liver (arrowhead) and hindbrain. (F) Left lateral view of a 5-dpf larva showing hnf-6 expression in the liver (black arrowheads), gallbladder (green arrowhead), and proximal intestine (brown arrowhead). |

Immunohistochemical detection of zebrafish bile ducts. (A) Histological cross section through the 5-dpf larval liver. Bile ducts are not recognizable in samples processed with standard fixatives (paraformaldehyde; hematoxylin staining). Arrowheads point to vascular sinusoids (clear regions) that contain nucleated red blood cells. (B) Histological cross section through the liver section of a whole-mount specimen (5 dpf) processed for cytokeratin IHC (methylene blue staining). (C) Fluorescent image of section in (B) showing bile ducts and vascular sinusoids (arrowheads). (D) Computer-assisted overlay of (C) on (B). |

Genomic organization and targeting of the zebrafish hnf-6 locus. (A) Genomic sequence and arrangement of zebrafish hnf-6. Two exons with adjacent intronic sequences are shown. Exon sequence is in CAPS, intron in lowercase. The sequence encoding the five amino acid insertion of the ?β? isoform is in bold. The sequences against which splice acceptor morpholinos were generated are underlined and labeled as IE2 and B-point, accordingly. Primer pair used for RT-PCR depicted in (B?D) is denoted by arrowheads. Diagram not to scale (intron approximately 4 kb). (B and C) Schematics of wild-type and morphant hnf-6 transcript, showing that the primer pair amplifies a fragment derived only from the wild-type transcript, as depicted in gold and green from the corresponding exons. (D and E) Semiquantitative (D) and quantitative (E) RT-PCR of cDNA from 24 hpf control (?wt?) and IE2-injected morphant embryos. There is a 50% reduction in the amplification of the cDNA fragments spanning the exons 1 and 2 splice site in morphant embryos compared with wild type. For all quantitative PCR experiments, hnf-6 cDNA amplification is standardized using amplification of the TATA-box binding protein (tbp) cDNA. |

Knockdown of hnf-6 perturbs biliary development. (A and B) Left lateral view of 5 dpf control (A) and hnf-6 morphant larvae. Black arrowhead?liver. Liver size is identical in both larvae. (C?N) Confocal projections through the liver of WT and hnf-6 morphant larvae processed for cytokeratin IHC. (D?F) Three individual 5 dpf hnf-6 morphants: note the relative paucity of ducts compared with WT control (C). The morphant ducts are shorter and more dilated than the WT ducts. (G?N) Biliary morphology of 3.5 dpf-5 dpf WT (G?J) and hnf-6 morphant (K?N) larvae. Note that the biliary tree of the 3.5-dpf control larva consists of short, isolated ductlike structures. Diffuse cytokeratin immunoreactivity is also present in adjacent cells (G). By 4 dpf (H), more distinct ducts are evident, but they remain isolated. By 4.5 dpf (I), the ducts have become longer, and some interconnecting ducts are apparent. These features are more elaborate at 5 dpf (J); long continuous ducts with numerous interconnecting branches and terminal ductules are present throughout the liver at this stage. While morphant ducts at 3.5 dpf (K) and 4 dpf (L) are similar to control, at 4.5 dpf (M) and 5 dpf (N) the ducts are less dense and the interconnecting ducts and terminal ductules do not appear. |

Reduced biliary lipid secretion and cholestasis in hnf-6 morphants. (A?D) Fluorescent images of 6 dpf larvae (right lateral view). (A and C) Endogenous, baseline gallbladder (arrowhead) and intestinal (arrow) fluorescence in 6 dpf WT (A) and hnf-6 morphant (C) larvae that did not receive the PED-6 lipid reporter. (B and D) Identical views of 6 dpf sibling larvae soaked overnight in PED-6. Note enhanced gallbladder fluorescence in WT (B) but not in the hnf-6 morphant (D). These images are representative of 20 paired sets of larvae examined. (E?H) Liver ultrastructure in 5 dpf WT (E and F) and hnf-6 morphant (G and H) larvae. Arrowheads point to lumen of the capillary-like ductules in the WT specimen. Arrows in all of these electron micrographs point to adjacent hepatocyte canaliculi. Ductular lumens in hnf-6 morphants (arrowheads) are enlarged and ectatic compared with WT. Scale bars = 2 μm. PHENOTYPE:
|

Biliary phenotype of vhnf1 mutant larvae. (A and B) Confocal projections through the liver of 5 dpf WT (A) and vhnf1 mutant (B) larvae processed for cytokeratin IHC. Note the short, dilated ducts in the vhnf1 mutants. PHENOTYPE:
|

hnf-6 regulates expression of vhnf1 and other liver genes. (A?D) Relative expression of vhnf1, hnf-4, hnf-3β, and ceruloplasmin (cer) genes in 3 dpf WT and hnf-6 morphant larvae. Data derived from real-time quantitative PCR using tbp gene expression as a standard. Error bars represent SEM of five separate experiments on pools of five to eight larvae. These data show that hnf-6 positively regulates vhnf1, hnf-4, and hnf-3β. Specificity of these results is supported by the normal expression of the hepatocyte marker cer in the hnf-6 morphants (D). (E?F) Left dorsolateral views of 3 dpf WT (E) and hnf-6 morphant (F) larvae processed for vhnf1 RNA in situ hybridization. Strong expression in the paired pronephric ducts (arrows) is seen in both larvae. However, there is minimal vhnf1 expression in the liver of the hnf-6 morphant (arrowhead). The larva shown is representative of 40% of hnf-6 morphants, with a range of expression patterns evident in the remainder. (G?I) Confocal projections through the liver of 5 dpf WT (G), hnf-6 morphant (H) larvae, and a larva coinjected with the hnf-6 morpholino and vhnf1 RNA (I). There is partial rescue of the hnf-6 morphant biliary phenotype in the vhnf1 RNA-injected larva (I). Ducts in this larva are narrowed and longer than in the uninjected morphant (H). Short, connecting ducts are also present in the vhnf1 RNA-injected larva. (J?L) Schematized versions of (G?I). Long ducts were traced in blue, interconnecting ducts in green, and terminal ductules in red. Compared with the wild-type larvae (J), there are shorter long ducts (blue), and fewer interconnecting ducts (green) and terminal ductules (red) in the hnf-6 morphant larva (K). Partial phenotype rescue occurs with coinjection of vhnf1 RNA and the hnf-6 morpholino (L). EXPRESSION / LABELING:
|
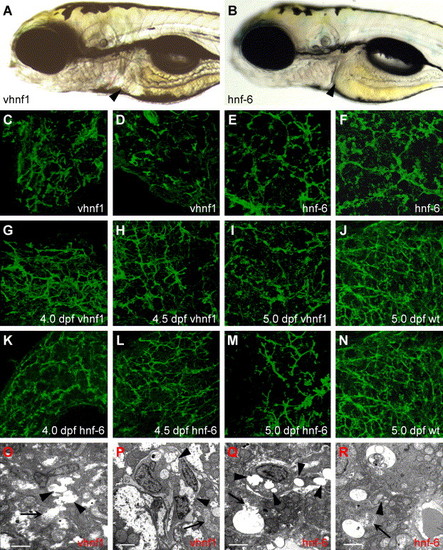
Forced expression of hnf-6 or vhnf1 perturbs biliary development. (A?B) Left lateral views of 5 dpf larva injected with vhnf1 (A) or hnf-6 (B) mRNA. These larvae are virtually indistinguishable from WT larvae. Liver size is normal in both larvae (arrowheads). (C?N) Confocal projections through the liver of vhnf1 (C, D, G?I) and hnf-6 (E, F, K?M) RNA-injected larvae processed for cytokeratin IHC. Forced expression of either gene disrupts biliary development of 5 dpf larvae (C?F, I, and M). Few normal bile ducts are seen in most RNA-injected larvae compared with WT (J and N). (G?I, K?M) Biliary morphology of 4 dpf-5 dpf vhnf1 RNA (G?I) and hnf-6 RNA (K?M) larvae. Bile duct development appears abnormal at all developmental time points when compared with 5 dpf WT (J and N) and at earlier stages (Fig. 4G?I). (O?R) Liver ultrastructure in 5dpf vhnf1 (O and P) and hnf-6 (Q and R) RNA-injected larvae. There is evidence of cholestasis in these larvae. Thin arrows point to canaliculi; these are dilated in both sets of RNA-injected larvae. In hnf-6 RNA larvae (Q and R), bile has overflowed into the hepatocyte cytoplasm. Arrowheads in these figures point to dilated ducts. Prominent cholestatic debris is present within duct lumen in (P and R). Scale bars = 2 μm. |

Knockdown of hnf-6 perturbs pancreatic ductular development but spares acinar and endocrine cells. (A and B) Confocal projections through the pancreas of 2 dpf WT (A) and hnf-6 morphant (B) embryos processed for insulin (red) and glucagon (green). Endocrine pancreas development is normal in both embryos. (C and D) Confocal projections through the pancreas of 5 dpf WT (A) and hnf-6 morphant (B) larvae processed for insulin (red) and carboxypeptidase-A (green) IHC. A normal distribution of both markers is seen in each larva. |
Reprinted from Developmental Biology, 274(2), Matthews, R.P., Lorent, K., Russo, P., and Pack, M., The zebrafish onecut gene hnf-6 functions in an evolutionarily conserved genetic pathway that regulates vertebrate biliary development, 245-259, Copyright (2004) with permission from Elsevier. Full text @ Dev. Biol.