
Fig. 6
|
Fig. 6
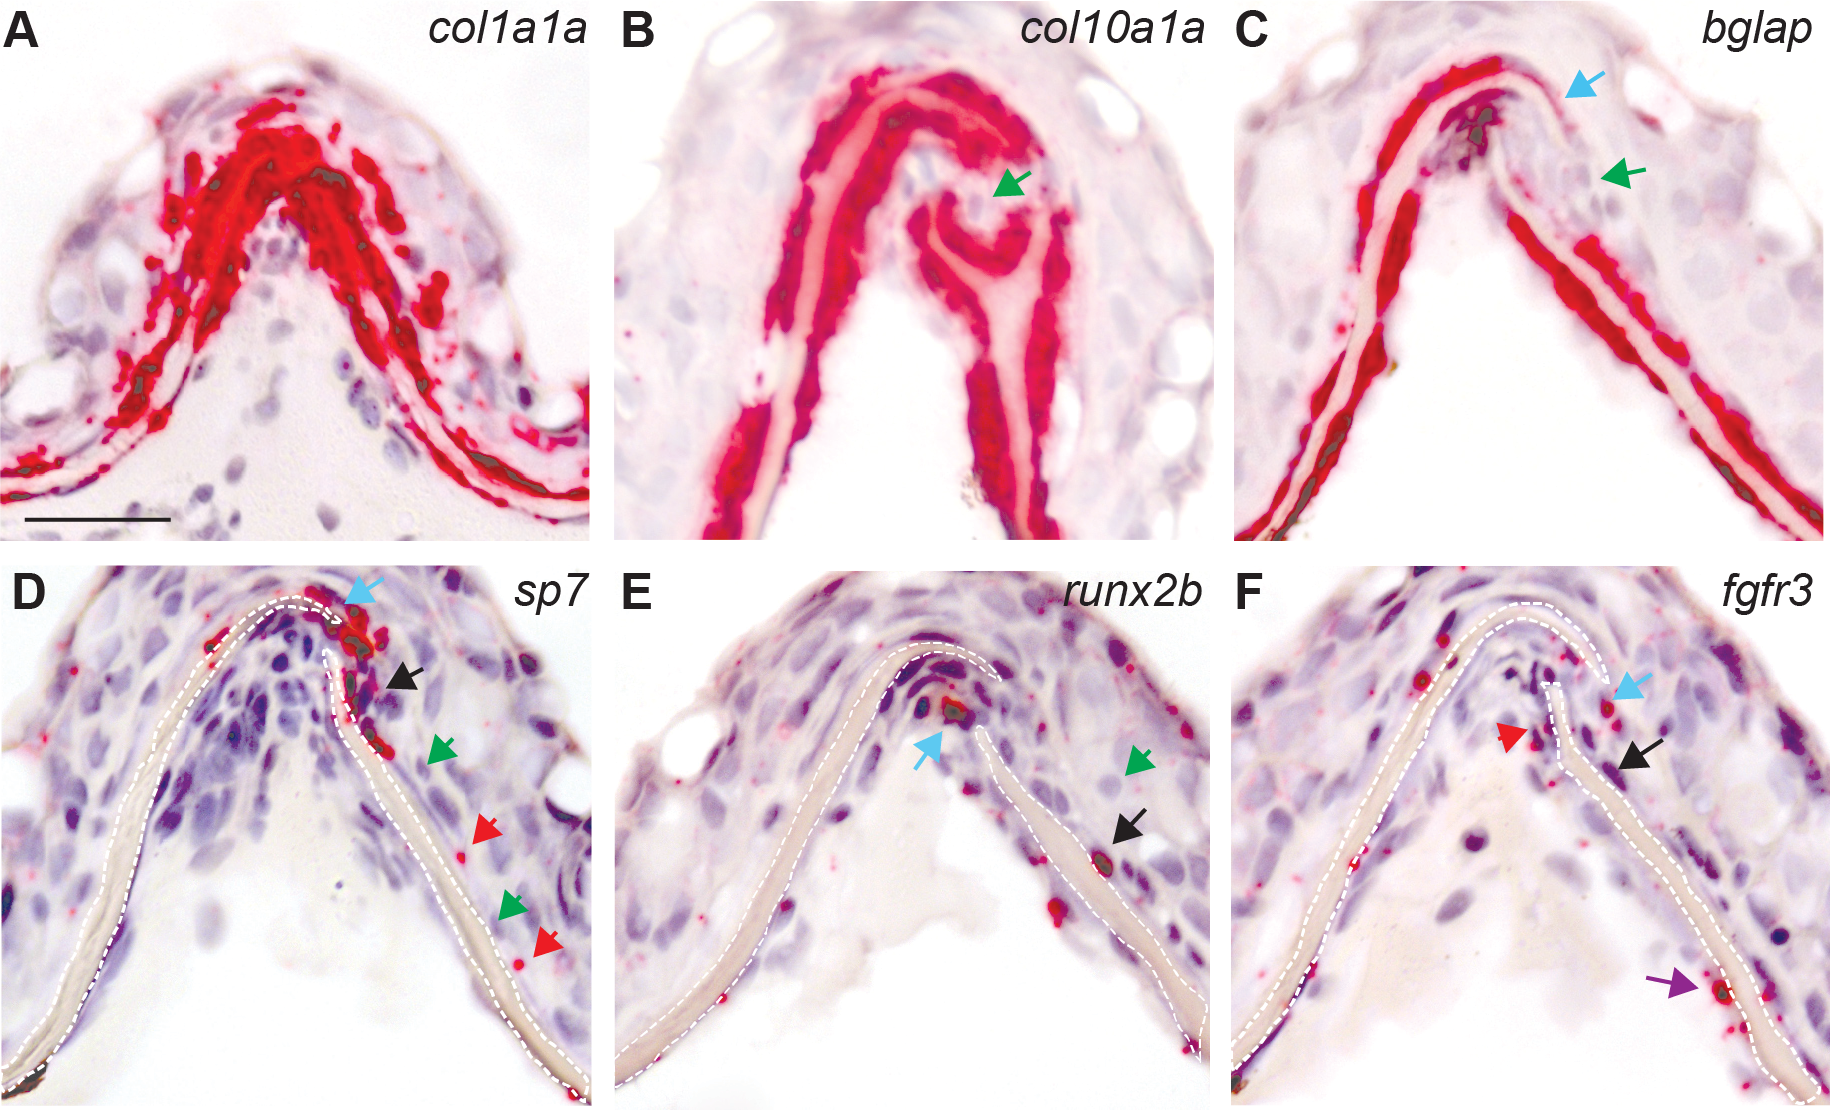
RNA detection for genetic markers of osteoblasts in juvenile animals assessed using RNAscope in situ hybridization on paraffin section.
(A-F) Sequential sections (4 μm) of the interfrontal suture collected from juvenile zebrafish at age of 6 wpf. The expression of individual genes is visualized in red, counterstained with haematoxylin for nuclei in purple; black arrows examples of positive expression, all green arrows indicate negative for expression cells. (A) The expression of col1a1a is present in all cells. (B) The green arrow indicates cells that are negative for col10a1a expression in the mid-suture domain. (C) Expression of bglap weaker at the tips of frontal bones as indicated by blue arrow. (D) Expression of sp7 at osteogenic fronts (blue arrow) and along the frontal bone (red arrow), (E) runx2b at the osteogenic front (blue arrow) and along the bone (black arrow). (F) fgfr3 expression observed in osteogenic front (blue arrow) and along the frontal bones (black and purple arrows). The scale bar represents 20 μm.