
Fig. 3
|
Fig. 3
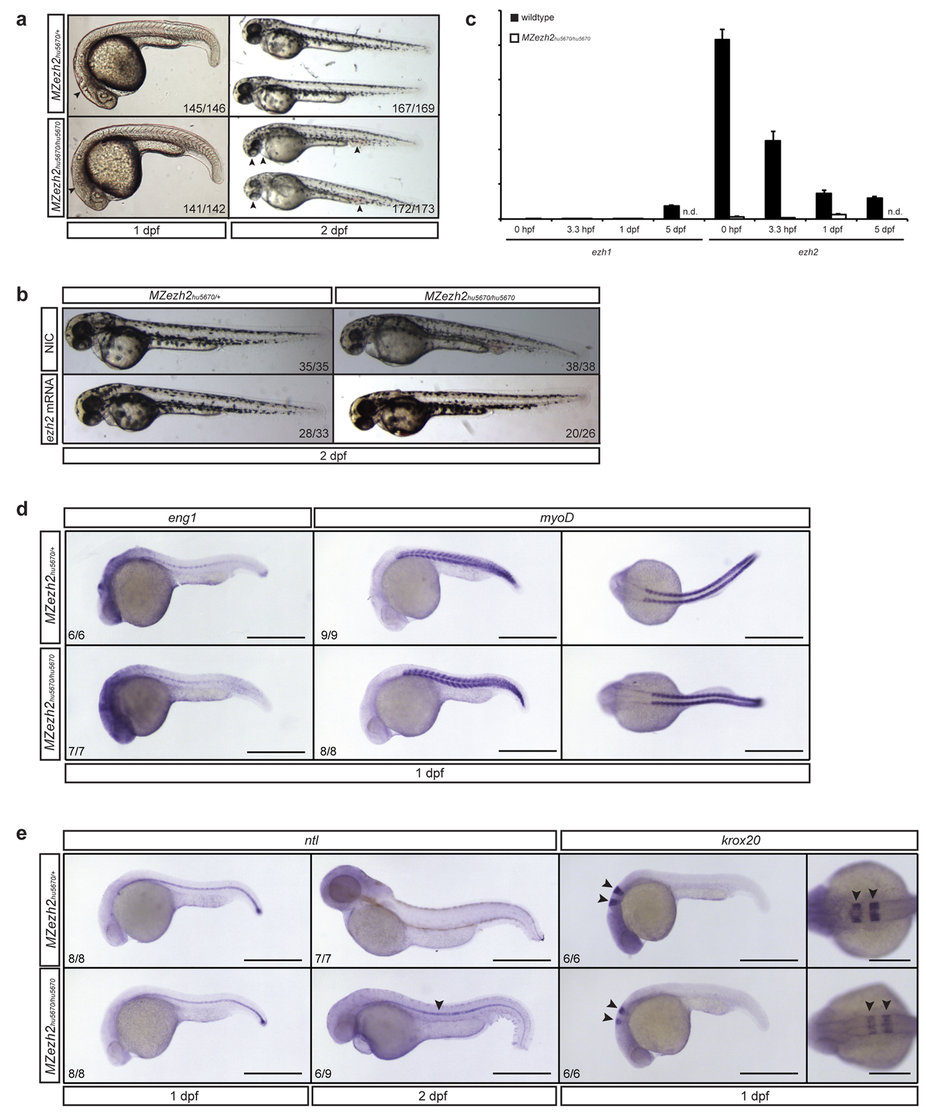
Maternal zygotic ezh2 mutants form a normal body plan and display a pleiotropic phenotype at 2 dpf.
(a) MZezh2hu5670/hu5670 appear relatively normal at 1 dpf, although a clear mid-hindbrain boundary appears to be absent (arrow head). They display a pleiotropic phenotype at 2 dpf, having small eyes, a stringy heart, and blood accumulation (arrow heads). MZezh2hu5670/+ show normal development. (b) The pleiotropic phenotypes of MZezh2hu5670/hu5670 can be rescued by injection of full-length ezh2 mRNA (300 pg). The numbers indicate the number of embryos with the displayed phenotype compared to the total number of embryos injected in two experiments. (c) Expression analysis of ezh1 and ezh2 in wildtype and MZezh2hu5670/hu5670 embryos at 0 hpf, 3.3 hpf, and 1 dpf. Expression of ezh1 is not detectable in MZezh2hu5670/hu5670 embryos and wildtype embryos at 0 hpf, 3.3 hpf, and 1 dpf. ezh1 is expressed in wildtype control embryos at 5 dpf. ezh2 is expressed in wildtype embryos at 0 hpf, 3.3 hpf, 1 dpf, and 5 dpf, showing a decrease in expression over time. ezh2 expression cannot be detected in MZezh2hu5670/hu5670 embryos. Relative expression was calculated based on expression of housekeeping genes β-actin and ef1α. Error bars represent standard deviation. n.d. is not done. (d) In situ hybridization for eng1 (muscle pioneer marker) and myoD (somite marker) at 1 dpf in MZezh2hu5670/hu5670 embryos and MZezh2hu5670/+. Both eng1 and myoD are normally expressed in MZezh2hu5670/hu5670 and MZezh2hu5670/+. Scale bar is 500 µm. (e) In situ hybridization for ntl at 1 dpf shows no difference in spatiotemporal expression between MZezh2hu5670/hu5670 embryos and the heterozygous siblings. At 2 dpf in situ hybridization for ntl showed expression in the notochord of MZezh2hu5670/hu5670 embryos, whereas this is not visible in MZezh2hu5670/+ (arrow head). In situ hybridization for krox20 at 1 dpf showed normal expression in MZezh2hu5670/+, but reduced expression in rhombomeres 3 and 5 in MZezh2hu5670/hu5670 embryos (arrow heads). Scale bar is 500 µm for lateral views and 250 µm for dorsal view of krox20 expression. The numbers indicate the number of embryos with the displayed phenotype compared to the total number of embryos analyzed.