FIGURE

FIGURE 5

ID
ZDB-FIG-231108-26
Publication
Neelamraju et al., 2023 - Depletion of tet2 results in age-dependent changes in DNA methylation and gene expression in a zebrafish model of myelodysplastic syndrome
Other Figures
All Figure Page
Back to All Figure Page
FIGURE 5

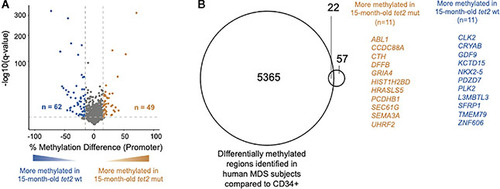
Overlap of DNA CpG promoter methylation in tet2m/m fish with changes previously reported in human MDS specimens. (A) The percentage differences in the methylation of cytosines within the promoter regions (500 bp to +250 bp upstream and downstream of the transcription initiation site) in the HSPCs of 15-month-old tet2m/m fish compared with those 15-month-old tet2wt/wt fish, with the latter as the baseline. The percentage difference in the methylation status of the CpG sites in each promoter region is plotted on the x-axis and the negative logarithm of the adjusted p-value is on the y-axis. The regions with an absolute change greater than 15% and an adjusted p-value less than 0.05 are colored. The genes that were hypermethylated in the 15-month-old tet2m/m fish are colored in orange and those that were hypomethylated are colored in blue. (B) Overlap of differentially methylated promoters identified in Figure 5A with those identified in human MDS specimens. Common genes are highlighted—genes in orange are hypermethylated in the HSPCs of 15-month-old tet2m/m fish and those in blue are hypomethylated in the HSPCs of 15-month-old tet2m/m fish.

Expression Data

Expression Detail
Antibody Labeling
Phenotype Data

Phenotype Detail
Acknowledgments
This image is the copyrighted work of the attributed author or publisher, and ZFIN has permission only to display this image to its users. Additional permissions should be obtained from the applicable author or publisher of the image. Full text @ Front Hematol