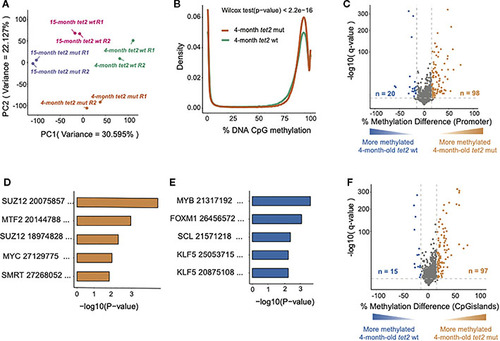
Loss of tet2 associated with the gain of CpG methylation in HSPCs of 4-month-old. (A) Principal component analysis (PCA) of high-variance CpGs showing the variability between biological samples and similarities between the replicates (the replicates are indicated as R1 and R2). (B) Density plots showing the distribution of the percent DNA CpG methylation in HSPCs of 4-month-old tet2m/m and 4-month-old tet2wt/wt fish. The difference between the distribution curves was calculated using the Wilcoxon rank-sum test. (C) The percentage differences in the methylation of cytosines within the promoter regions (500 bp to +250 bp upstream and downstream of the transcription initiation site) of annotated genes from 4-month-old tet2m/m fish compared with 4-month-old tet2wt/wt fish. The percentage difference in the methylation status of CpG sites in each promoter region is plotted on the x-axis and the negative logarithm of the adjusted p-value is on the y-axis. The promoters with an absolute change greater than 15% and an adjusted p-value less than 0.05 are colored. Genes that were hypermethylated in the 4-month-old tet2m/m fish are colored in orange and those that were hypomethylated are colored in blue. (D) Gene set enrichment analysis of hypermethylated gene promoters (human orthologs) against the transcription factor target ChEA 2022 database using EnrichR. The five most significant pathways are shown. The x-axis indicates the negative logarithm of the p-value from the enrichment results. (E) Gene set enrichment analysis of hypomethylated gene promoters (human orthologs) against the transcription factor target (ChEA 2022) database using EnrichR, as in panel (C) The five most significant pathways were plotted. The x-axis shows the negative logarithm of the p-value from the enrichment results. (F) The percentage differences in the methylation of cytosines within the CpG island regions in 4-month-old tet2m/m fish compared with 4-month-old tet2wt/wt fish. The percentage difference in the methylation status of CpG sites in each CpG island region is plotted on the x-axis and the negative logarithm of the adjusted p-value is on the y-axis. The CpG islands with an absolute change greater than 15% and an adjusted p-value less than 0.05 are colored. The CpG islands that were hypermethylated in the 4-month-old tet2m/m fish are colored in orange and those that were hypomethylated are colored in blue.
|
