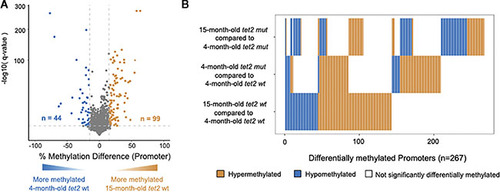
DNA methylation changes in HSPCs of aging tet2wt/wt fish. (A) The percentage differences in the methylation of cytosines within the promoter regions (500 bp to +250 bp upstream and downstream of the transcription initiation site). HSPCs from 15-month-old tet2wt/wt fish were compared with those of 4-month-old tet2wt/wt fish, with the latter as the baseline. The percentage difference in the methylation status of CpG sites in each promoter region is plotted on the x-axis and the negative logarithm of the adjusted p-value is on the y-axis. The regions with an absolute change greater than 15% and an adjusted p-value less than 0.05 are colored. The genes that were hypermethylated in the 15-month-old tet2wt/wt fish are colored in orange and those that were hypomethylated are colored in blue. (B) Horizontal bar plot comparing the methylation status of significantly differentially methylated promoters identified in 15-month-old tet2m/m fish compared with 4-month-old tet2m/m fish (top); 4-month-old tet2m/m fish compared with 4-month-old tet2wt/wt fish (middle); and 15-month-old tet2wt/wt fish compared with 4-month-old tet2wt/wt fish (bottom). Orange represents > 15% hypermethylation, blue represents > 15% hypomethylation, and white represents no differential methylation.
|
