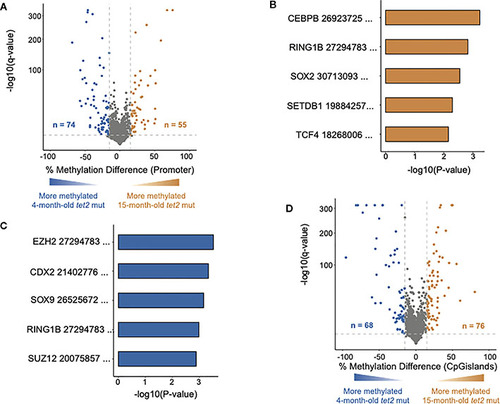
DNA methylation changes in HSPCs of aging tet2m/m fish. (A) The percentage differences in the methylation of cytosines within the promoter regions (500 bp to +250 bp upstream and downstream of the transcription initiation site) of annotated genes from 15-month-old tet2m/m fish compared with 4-month-old tet2m/m fish. The percentage difference in the methylation status of each promoter region is plotted on the x-axis and the negative logarithm of the adjusted p-value is on the y-axis. The regions with an absolute change greater than 15% and an adjusted p-value less than 0.05 are colored. The genes that were hypermethylated in the 15-month-old tet2m/m fish are colored in orange and those that were hypomethylated are colored in blue. (B) Gene set enrichment analysis of hypermethylated gene promoters (human orthologs) against the ChEA 2022 database using EnrichR. The top five significant pathways were plotted. The x-axis indicates the negative logarithm of the p-value from the enrichment results. The y-axis represents individual pathways. (C) Gene set enrichment analysis of hypomethylated gene promoters (human orthologs) against the transcription factor target database (ChEA 2022) using EnrichR. The top five significant pathways were plotted. The x-axis indicates the negative logarithm of the p-value from the enrichment results. The y-axis indicates the individual pathways. (D) The percentage differences in the methylation of cytosines within the CpG island regions in 15-month-old tet2m/m fish compared with 4-month-old tet2m/m fish. The percentage difference in methylation status of CpG sites in each CpG island region is plotted on the x-axis and the negative logarithm of the adjusted p-value is on the y-axis. The CpG islands with an absolute change greater than 15% and an adjusted p-value less than 0.05 are colored. The CpG islands that were hypermethylated in the 4-month-old tet2m/m fish are colored in orange and those that were hypomethylated are colored in blue.
|
