
- Title
-
Depletion of tet2 results in age-dependent changes in DNA methylation and gene expression in a zebrafish model of myelodysplastic syndrome
- Authors
- Neelamraju, Y., Gjini, E., Chhangawala, S., Fan, H., He, S., Jing, C.B., Nguyen, A.T., Prajapati, S., Sheridan, C., Houvras, Y., Melnick, A., Look, A.T., Garrett-Bakelman, F.E.
- Source
- Full text @ Front Hematol

Schematic overview of studies of DNA methylation and RNA expression by zebrafish kidney marrow cells. The site of hematopoiesis in the adult zebrafish is in the head kidney (upper left of the diagram). Head kidney marrow cells from 4- and 15-month-old zebrafish were isolated and the progenitor cells were sorted by fluorescence-activated cell sorting based on their forward and side light scatter properties, as previously described ( |
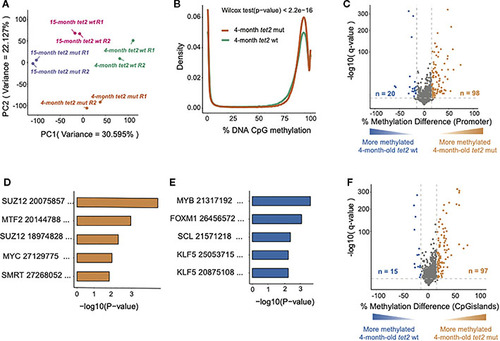
Loss of |
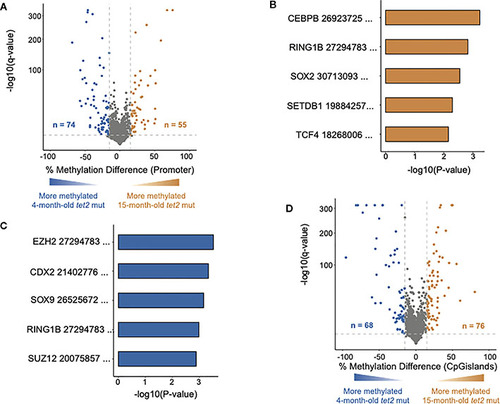
DNA methylation changes in HSPCs of aging |
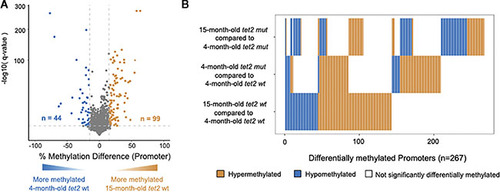
DNA methylation changes in HSPCs of aging |
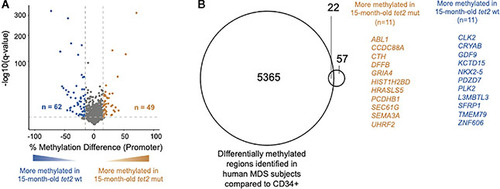
Overlap of DNA CpG promoter methylation in |

Loss of |
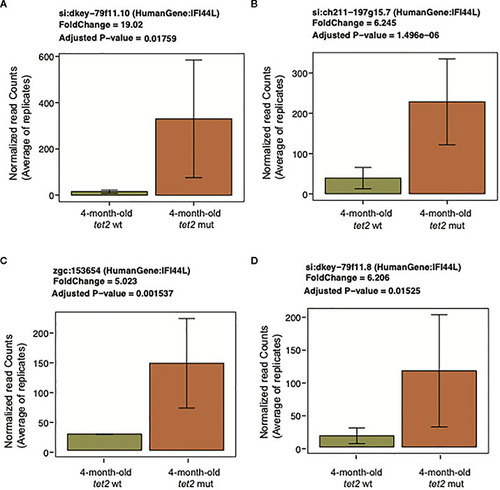
Upregulation of interferon-induced protein 44-like ( |

Representative downregulated genes associated with the heme metabolism pathway. Bar plots representing the normalized expression values averaged across replicates on the |
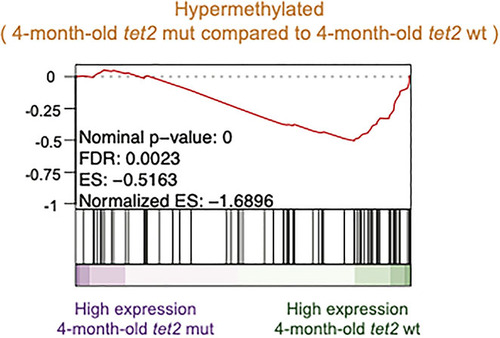
Negative association between hypermethylated gene promoters and gene expression changes observed in 4-month-old |