
Fig. 3
- ID
- ZDB-FIG-230809-9
- Publication
- Prendergast et al., 2023 - CSF-contacting neurons respond to Streptococcus pneumoniae and promote host survival during central nervous system infection
- Other Figures
- All Figure Page
- Back to All Figure Page
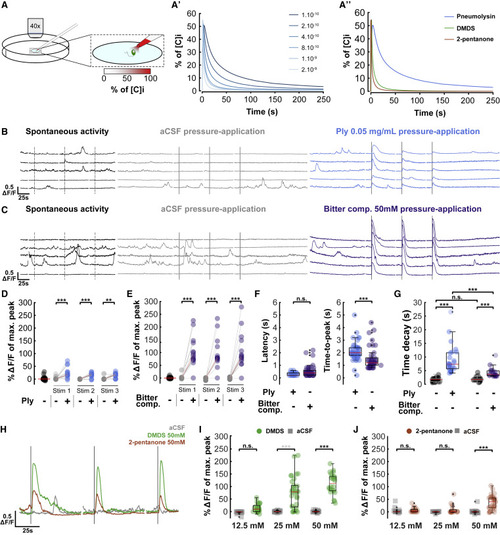
Figure 3. CSF-cNs respond in vitro to pneumolysin and bitter compounds (A) Simulations of in vitro CSF-cN stimulation. (A) Schematic view of the in vitro stimulation experimental setup combining calcium imaging at 40×, 5 Hz and stimulation of CSF-cN with a gradient of molecule. (A′) Simulation of the concentration of molecule sensed by CSF-cN for a range of coefficients of diffusion (from 1 × 10⁻¹⁰ to 2 × 10⁻⁹ m2/s); [C]i corresponds to initial concentration in the stimulation pipette. (A″) Simulation of the concentration of pneumolysin (Ply), dimethyl disulfide (DMDS), and 2-pentanone; coefficients of diffusion: 1 × 10⁻¹⁰, 1 × 10⁻⁹, and 2 × 10⁻⁹ m2/s, respectively; [C]i corresponds to initial concentration within the stimulation pipette. (B) Representative individual in vitro CSF-cN Ca2+ traces from no stimulation control (left, dark), 3 successive 1-s stimulations of aCSF (middle, gray), and 3 successive 1-s stimulations of 0.05 mg/mL pneumolysin (Ply) (right, blue). Dark lines correspond to 1-s stimulations, and dashed lines correspond to putative 1-s stimulations during spontaneous activity. Vertical scale, 0.5 ΔF/F; horizontal scale, 25 s. (C) Representative individual in vitro CSF-cN Ca2+ traces from no stimulation control (left, dark), 3 successive 1-s stimulations of aCSF (middle, gray), and 3 successive 1-s stimulations of 50 mM bitter compounds mix (right, purple). Bitter compound mix: acetone, 2-butanone, 2-pentanone, 2-methylpropanal, and dimethyl disulfide (DMDS). Dark lines correspond to 1-s stimulations, and dashed lines correspond to putative 1-s stimulations during spontaneous activity. Vertical scale, 0.5 ΔF/F; horizontal scale, 25 s. (D) Quantification of calcium transients’ amplitude elicited by pneumolysin pressure application. Paired line plots showing responses of individual cells to absence of stimulation (corresponding to spontaneous activity, on the left in black circle) or 3 successive 1-s stimuli of aCSF (gray circle) versus 0.05 mg/mL pneumolysin (Ply, blue circle). Two-factor ANOVA, treatment factor F = 66.185, p = 1.47 × 10⁻¹², Tukey HSD post hoc testing, ∗∗∗p < 0.001. Red bar: median ΔF/F (median spontaneous activity = 0.03%; median Ply = 17.49% and median aCSF = 0.19% for stimulation 1; median Ply = 18.78% and median aCSF = 0.03% for stimulation 2; median Ply = 17.20% and median aCSF = −0.20% for stimulation 3), 16 responding cells out of 17. (E) Quantification of the amplitude and kinematics of calcium transients elicited by pressure application of bitter compounds. Paired line plots showing responses of individual cells to absence of stimulation (corresponding to spontaneous activity, on the left in black circle) or 3 successive 1-s stimuli of aCSF (gray circle) versus 50 mM bitter compounds mix (purple circle). Two-factor ANOVA, treatment factor F = 116.762, p < 2.0 × 10⁻¹⁶, Tukey HSD post hoc testing, ∗∗∗p < 0.001. Red bar: median ΔF/F (median spontaneous activity = 0.10%; median bitter compounds = 87.26% and median aCSF = 0.05% for stimulation 1; median bitter compounds = 78.85% and median aCSF = −0.13% for stimulation 2; median bitter compounds = 83.64% and median aCSF = −0.50% for stimulation 3), 15 responding cells out of 15. (F) Quantification of latency and time-to-peak after pneumolysin (blue circle) or bitter compounds in mix (purple circle) stimuli. Red bar: median (for latency, median Ply = 0.2 s and median bitter compounds = 0.4 s, p > 0.05; for time-to-peak, median Ply = 2 s and median bitter compounds = 1.2 s, p < 1 × 10⁻⁶; Kolmogorov-Smirnov test). Boxplot represents IQR ± minimum/maximum sans outliers. (G) Quantification of time decay for spontaneous activity (black circle) or after pneumolysin (blue circle) or bitter compounds in mix (purple circle) stimuli. Red bar: median (on the left, median Ply = 7.36 s and median spontaneous activity = 1.71 s, p < 1 × 10⁻¹¹; on the right, median bitter compounds = 3.59 s and median spontaneous activity = 1.69 s, p < 1 × 10⁻⁶, Ply and bitter compounds decays are different, p < 1 × 10⁻⁴; Kolmogorov-Smirnov test). Boxplot represents IQR ± minimum/maximum sans outliers. Longer time decay for Ply compared with bitter compounds in mix is probably due to a smaller coefficient of diffusion as shown in (A″). (H) Illustration of calcium transients after pressure application of DMDS and 2-pentanone. Representative individual in vitro CSF-cN Ca2+ traces from 3 successive 1-s stimulations with either aCSF (gray), DMDS 50 mM (green), or 2-pentanone 50 mM (brown). Dark lines correspond to 1-s stimulations. Vertical scale, 0.5 ΔF/F; horizontal scale, 25 s. (I) Quantification of calcium transients after aCSF (gray circle) or DMDS (green circle) stimuli. Two-factor ANOVA, treatment factor F = 170.58, p ≤ 2.0 × 10⁻¹⁶, concentration factor F = 29.43, p = 1.66 × 10⁻¹¹, Tukey HSD post hoc testing, ∗∗∗p < 0.001, n.s., not significant. Red bar: median ΔF/F (median 12.5 mM DMDS = 9.44% and median aCSF = −1.20%, 6 responding cells out of 8; median 25 mM DMDS = 78.96% and median aCSF = −0.26%, 8 responding cells out of 10; median 50 mM DMDS = 112.09% and median aCSF = −0.54%, 8 responding cells out of 8). Boxplot represents IQR ± minimum/maximum sans outliers. (J) Quantification of calcium transients after aCSF (gray circle) or 2-pentanone (brown circle) stimuli. Two-factor ANOVA, treatment factor F = 53.48, p = 2.67 × 10⁻¹¹, concentration factor F = 13.89, p = 3.53 × 10⁻⁶, Tukey HSD post hoc testing, ∗∗∗p < 0.001, n.s., not significant. Red bar: median ΔF/F (median 12.5 mM 2-pentanone = 2.19% and median aCSF = 0.14%, 4 responding cells out of 6; median 25 mM DMDS = 0.63% and median aCSF = 0.04%, 3 responding cells out of 6; median 50 mM DMDS = 39.72% and median aCSF = −0.39%, 9 responding cells out of 10). Boxplot represents IQR ± minimum/maximum sans outliers. Figure S2 shows similar results for bitter compounds that do not activate CSF-cNs, suggesting some specificity. See also Figure S2 and Video S2. |