
Fig. 1
- ID
- ZDB-FIG-230809-7
- Publication
- Prendergast et al., 2023 - CSF-contacting neurons respond to Streptococcus pneumoniae and promote host survival during central nervous system infection
- Other Figures
- All Figure Page
- Back to All Figure Page
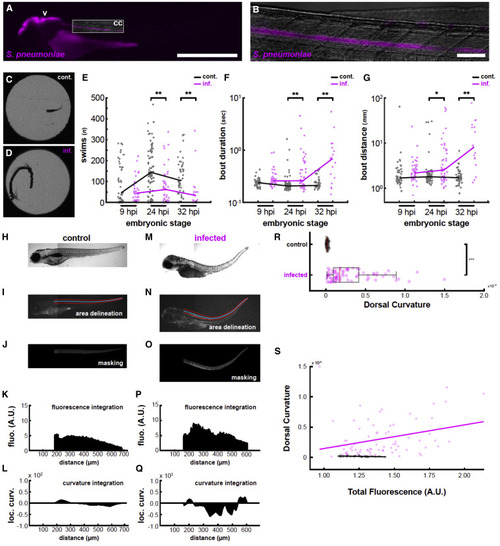
Figure 1. Infection induces behavioral changes and spinal curvature reminiscent of clinical symptoms of pneumococcal meningitis (A) Fluorescence image of a larva infected with mCherry-labeled S. pneumoniae at 2 dpf and imaged at 24 hpi showing colonization of the brain ventricle (v) and central canal (cc). Box indicates field of view for (B). Scale bars, 500 μm. (B) Higher magnification image of the central canal colonized with mCherry-labeled S. pneumoniae. Scale bars, 50 μm. (C) Representative motion overlay of a detected swim bout from a larva injected with vehicle. Most bouts are short forward swims. (D) Representative motion overlay of a detected swim bout from a larva infected with S. pneumoniae. These swim bouts tend to be much longer in duration and distance. (E) Quantification of the overall number of bouts in PBS-injected (gray) and S. pneumoniae-infected (magenta) fish at three different time points post infection. At later infection time points, infected fish swim substantially less often (∗∗p < 0.01). (F) Quantification of bout duration in control versus infected fish. As infection progresses, swim bouts become substantially and progressively longer in infected fish while generally remaining stable in controls. (G) Quantification of bout distance in control versus infected fish. Similarly to (E), infected fish swim substantially farther in a given bout than control fish (∗p < 0.05). (H) Bright-field image of a PBS-injected larva at 3 dpf. (I) Spinal cord area (here in the control larva of H) was defined by manual tracing (red lines), from which a smoothing spline curve was fit (blue line). (J) The resulting boundaries were used to isolate a masked portion of the red channel. Since this larva was not injected with fluorophores, this represents autofluorescence. (K) The resulting image patch was summed along the x axis to derive a fluorescence plot. (L) Curvature was locally determined along the x axis and plotted. Positive values indicate downward curvature, and negative values indicate upward curvature. (M) Bright-field image of a larva injected with S. pneumoniae at 2 dpf and imaged at 32 hpi. Note the strong upward tail curvature. (N) Similar spinal cord delineation as in (M) but applied to the larva in (K). (O) Red channel fluorescence from the masked spinal cord of the infected larvae. Since this embryo was injected with mCherry-labeled S. pneumoniae, this plot provides a visual assessment of infection progression. (P) Similar fluorescence plot as in (K). Note that fluorescence is overall higher than in (K). (Q) Similar curvature plot as in (L). The larva’s strong upward spinal curvature is reflected in the large downward deflection of the curvature plot midway along the anterior/posterior axis. (R) Quantification of the absolute value of the curvature along the spinal cord in control (PBS) and infected fish. Infected fish exhibit significant greater spinal curvature (p < 10−16). Red bars represent the medians. Boxplot represents IQR ± minimum/maximum sans outliers. (S) Fluorescence was quantified along the spinal cord for all fish and plotted against overall curvature. In infected fish (in purple), there is a positive correlation between spinal fluorescence (i.e., implied infection progression) and spinal curvature (R2 = 0.0900, p = 0.0089), while control fish (in black) do not show positive correlation (R2 = 0.0892, p = 0.1230). n = 29 PBS-injected larvae; n = 75 S. pneumoniae-injected larvae. See also Table S1. |