
- Title
-
CSF-contacting neurons respond to Streptococcus pneumoniae and promote host survival during central nervous system infection
- Authors
- Prendergast, A.E., Jim, K.K., Marnas, H., Desban, L., Quan, F.B., Djenoune, L., Laghi, V., Hocquemiller, A., Lunsford, E.T., Roussel, J., Keiser, L., Lejeune, F.X., Dhanasekar, M., Bardet, P.L., Levraud, J.P., van de Beek, D., Vandenbroucke-Grauls, C.M.J.E., Wyart, C.
- Source
- Full text @ Curr. Biol.
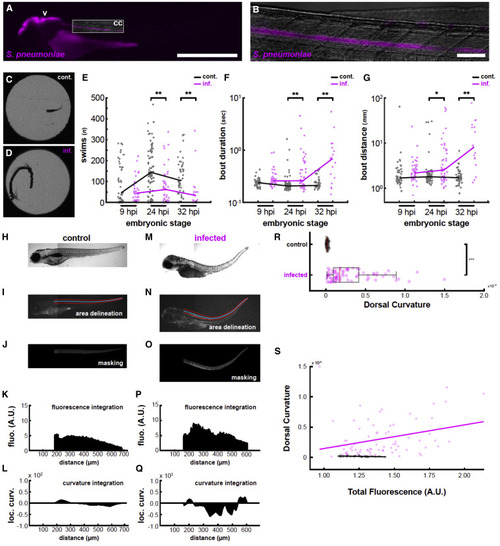
Figure 1. Infection induces behavioral changes and spinal curvature reminiscent of clinical symptoms of pneumococcal meningitis (A) Fluorescence image of a larva infected with mCherry-labeled S. pneumoniae at 2 dpf and imaged at 24 hpi showing colonization of the brain ventricle (v) and central canal (cc). Box indicates field of view for (B). Scale bars, 500 μm. (B) Higher magnification image of the central canal colonized with mCherry-labeled S. pneumoniae. Scale bars, 50 μm. (C) Representative motion overlay of a detected swim bout from a larva injected with vehicle. Most bouts are short forward swims. (D) Representative motion overlay of a detected swim bout from a larva infected with S. pneumoniae. These swim bouts tend to be much longer in duration and distance. (E) Quantification of the overall number of bouts in PBS-injected (gray) and S. pneumoniae-infected (magenta) fish at three different time points post infection. At later infection time points, infected fish swim substantially less often (∗∗p < 0.01). (F) Quantification of bout duration in control versus infected fish. As infection progresses, swim bouts become substantially and progressively longer in infected fish while generally remaining stable in controls. (G) Quantification of bout distance in control versus infected fish. Similarly to (E), infected fish swim substantially farther in a given bout than control fish (∗p < 0.05). (H) Bright-field image of a PBS-injected larva at 3 dpf. (I) Spinal cord area (here in the control larva of H) was defined by manual tracing (red lines), from which a smoothing spline curve was fit (blue line). (J) The resulting boundaries were used to isolate a masked portion of the red channel. Since this larva was not injected with fluorophores, this represents autofluorescence. (K) The resulting image patch was summed along the x axis to derive a fluorescence plot. (L) Curvature was locally determined along the x axis and plotted. Positive values indicate downward curvature, and negative values indicate upward curvature. (M) Bright-field image of a larva injected with S. pneumoniae at 2 dpf and imaged at 32 hpi. Note the strong upward tail curvature. (N) Similar spinal cord delineation as in (M) but applied to the larva in (K). (O) Red channel fluorescence from the masked spinal cord of the infected larvae. Since this embryo was injected with mCherry-labeled S. pneumoniae, this plot provides a visual assessment of infection progression. (P) Similar fluorescence plot as in (K). Note that fluorescence is overall higher than in (K). (Q) Similar curvature plot as in (L). The larva’s strong upward spinal curvature is reflected in the large downward deflection of the curvature plot midway along the anterior/posterior axis. (R) Quantification of the absolute value of the curvature along the spinal cord in control (PBS) and infected fish. Infected fish exhibit significant greater spinal curvature (p < 10−16). Red bars represent the medians. Boxplot represents IQR ± minimum/maximum sans outliers. (S) Fluorescence was quantified along the spinal cord for all fish and plotted against overall curvature. In infected fish (in purple), there is a positive correlation between spinal fluorescence (i.e., implied infection progression) and spinal curvature (R2 = 0.0900, p = 0.0089), while control fish (in black) do not show positive correlation (R2 = 0.0892, p = 0.1230). n = 29 PBS-injected larvae; n = 75 S. pneumoniae-injected larvae. See also Table S1. |
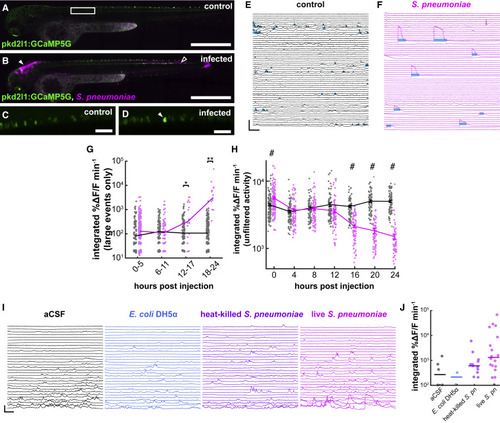
Figure 2. Activity of CSF-cNs drastically changes in response to the invasion of Streptococcus pneumoniae into the CSF (A) Untreated 3 dpf Tg(pkd2l1:GCaMP5G) larva. Box indicates field of view for (C) and (D). Scale bars, 500 μm. (B) Sibling larva, 24 hpi of fluorescently labeled S. pneumoniae into the hindbrain ventricle (HBV, indicated by filled arrowhead); empty arrowhead indicates extent of bacterial proliferation. (C) Higher magnification image of control CSF-cN calcium imaging. Scale bars, 50 μm. (D) Comparable image from an infected larva with S. pneumoniae. Arrowhead indicates a CSF-cN undergoing a high-amplitude transient. (E) Ca2+ activity plots of uninfected CSF-cNs 21 h after the beginning of the experiment. Cyan bars indicate detected long-lasting high-amplitude events. Vertical scale, 500% ΔF/F; horizontal scale, 20 s. These events precede the arrival of neutrophils (Figure S1). (F) Similar plots from CSF-cNs of infected larvae showing high-amplitude transients. (G) Quantification of software-detected high-amplitude transients in control (gray) and S. pneumoniae-infected (magenta) larvae. Large transients appear 12 hpi (lines represent median values, Wilcoxon signed-rank test, ∗p < 0.0125, ∗∗p < 0.0063). (H) Integrated Ca2+ activity in CSF-cNs in control (gray) and infected (magenta) larvae over 24 h of infection. Overall activity undergoes a decline over the course of infection (two-factor ANOVA, injection factor F = 124.36, p = 1.61 × 10⁻²⁷, Scheffé post hoc testing, #p < 0.05, data are represented as mean ± SEM). (I) Individual CSF-cN Ca2+ traces from 2 dpf zebrafish injected with aCSF, DH5α Escherichia coli, heat-killed S. pneumoniae, and live S. pneumoniae. Injection with live S. pneumoniae elicits by far the largest transients. Vertical scale, 200% ΔF/F; horizontal scale, 25 s. (J) Quantification of software-detected large transients from the four conditions in (M); lines represent median values. More transients are observed in live infected fish than the other three conditions (chi-square test, p = 6.28E−16). See also Figure S1, Table S1, and Video S1. |
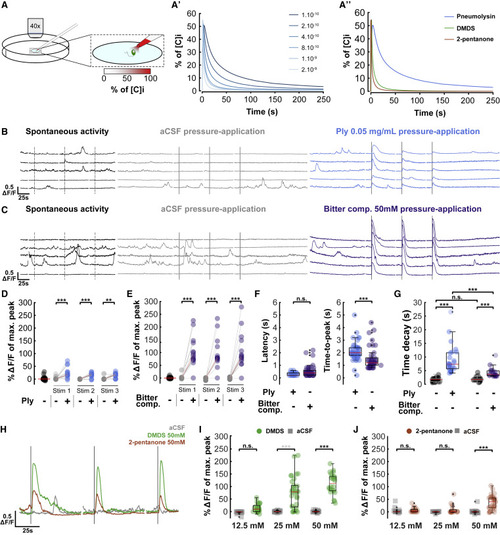
Figure 3. CSF-cNs respond in vitro to pneumolysin and bitter compounds (A) Simulations of in vitro CSF-cN stimulation. (A) Schematic view of the in vitro stimulation experimental setup combining calcium imaging at 40×, 5 Hz and stimulation of CSF-cN with a gradient of molecule. (A′) Simulation of the concentration of molecule sensed by CSF-cN for a range of coefficients of diffusion (from 1 × 10⁻¹⁰ to 2 × 10⁻⁹ m2/s); [C]i corresponds to initial concentration in the stimulation pipette. (A″) Simulation of the concentration of pneumolysin (Ply), dimethyl disulfide (DMDS), and 2-pentanone; coefficients of diffusion: 1 × 10⁻¹⁰, 1 × 10⁻⁹, and 2 × 10⁻⁹ m2/s, respectively; [C]i corresponds to initial concentration within the stimulation pipette. (B) Representative individual in vitro CSF-cN Ca2+ traces from no stimulation control (left, dark), 3 successive 1-s stimulations of aCSF (middle, gray), and 3 successive 1-s stimulations of 0.05 mg/mL pneumolysin (Ply) (right, blue). Dark lines correspond to 1-s stimulations, and dashed lines correspond to putative 1-s stimulations during spontaneous activity. Vertical scale, 0.5 ΔF/F; horizontal scale, 25 s. (C) Representative individual in vitro CSF-cN Ca2+ traces from no stimulation control (left, dark), 3 successive 1-s stimulations of aCSF (middle, gray), and 3 successive 1-s stimulations of 50 mM bitter compounds mix (right, purple). Bitter compound mix: acetone, 2-butanone, 2-pentanone, 2-methylpropanal, and dimethyl disulfide (DMDS). Dark lines correspond to 1-s stimulations, and dashed lines correspond to putative 1-s stimulations during spontaneous activity. Vertical scale, 0.5 ΔF/F; horizontal scale, 25 s. (D) Quantification of calcium transients’ amplitude elicited by pneumolysin pressure application. Paired line plots showing responses of individual cells to absence of stimulation (corresponding to spontaneous activity, on the left in black circle) or 3 successive 1-s stimuli of aCSF (gray circle) versus 0.05 mg/mL pneumolysin (Ply, blue circle). Two-factor ANOVA, treatment factor F = 66.185, p = 1.47 × 10⁻¹², Tukey HSD post hoc testing, ∗∗∗p < 0.001. Red bar: median ΔF/F (median spontaneous activity = 0.03%; median Ply = 17.49% and median aCSF = 0.19% for stimulation 1; median Ply = 18.78% and median aCSF = 0.03% for stimulation 2; median Ply = 17.20% and median aCSF = −0.20% for stimulation 3), 16 responding cells out of 17. (E) Quantification of the amplitude and kinematics of calcium transients elicited by pressure application of bitter compounds. Paired line plots showing responses of individual cells to absence of stimulation (corresponding to spontaneous activity, on the left in black circle) or 3 successive 1-s stimuli of aCSF (gray circle) versus 50 mM bitter compounds mix (purple circle). Two-factor ANOVA, treatment factor F = 116.762, p < 2.0 × 10⁻¹⁶, Tukey HSD post hoc testing, ∗∗∗p < 0.001. Red bar: median ΔF/F (median spontaneous activity = 0.10%; median bitter compounds = 87.26% and median aCSF = 0.05% for stimulation 1; median bitter compounds = 78.85% and median aCSF = −0.13% for stimulation 2; median bitter compounds = 83.64% and median aCSF = −0.50% for stimulation 3), 15 responding cells out of 15. (F) Quantification of latency and time-to-peak after pneumolysin (blue circle) or bitter compounds in mix (purple circle) stimuli. Red bar: median (for latency, median Ply = 0.2 s and median bitter compounds = 0.4 s, p > 0.05; for time-to-peak, median Ply = 2 s and median bitter compounds = 1.2 s, p < 1 × 10⁻⁶; Kolmogorov-Smirnov test). Boxplot represents IQR ± minimum/maximum sans outliers. (G) Quantification of time decay for spontaneous activity (black circle) or after pneumolysin (blue circle) or bitter compounds in mix (purple circle) stimuli. Red bar: median (on the left, median Ply = 7.36 s and median spontaneous activity = 1.71 s, p < 1 × 10⁻¹¹; on the right, median bitter compounds = 3.59 s and median spontaneous activity = 1.69 s, p < 1 × 10⁻⁶, Ply and bitter compounds decays are different, p < 1 × 10⁻⁴; Kolmogorov-Smirnov test). Boxplot represents IQR ± minimum/maximum sans outliers. Longer time decay for Ply compared with bitter compounds in mix is probably due to a smaller coefficient of diffusion as shown in (A″). (H) Illustration of calcium transients after pressure application of DMDS and 2-pentanone. Representative individual in vitro CSF-cN Ca2+ traces from 3 successive 1-s stimulations with either aCSF (gray), DMDS 50 mM (green), or 2-pentanone 50 mM (brown). Dark lines correspond to 1-s stimulations. Vertical scale, 0.5 ΔF/F; horizontal scale, 25 s. (I) Quantification of calcium transients after aCSF (gray circle) or DMDS (green circle) stimuli. Two-factor ANOVA, treatment factor F = 170.58, p ≤ 2.0 × 10⁻¹⁶, concentration factor F = 29.43, p = 1.66 × 10⁻¹¹, Tukey HSD post hoc testing, ∗∗∗p < 0.001, n.s., not significant. Red bar: median ΔF/F (median 12.5 mM DMDS = 9.44% and median aCSF = −1.20%, 6 responding cells out of 8; median 25 mM DMDS = 78.96% and median aCSF = −0.26%, 8 responding cells out of 10; median 50 mM DMDS = 112.09% and median aCSF = −0.54%, 8 responding cells out of 8). Boxplot represents IQR ± minimum/maximum sans outliers. (J) Quantification of calcium transients after aCSF (gray circle) or 2-pentanone (brown circle) stimuli. Two-factor ANOVA, treatment factor F = 53.48, p = 2.67 × 10⁻¹¹, concentration factor F = 13.89, p = 3.53 × 10⁻⁶, Tukey HSD post hoc testing, ∗∗∗p < 0.001, n.s., not significant. Red bar: median ΔF/F (median 12.5 mM 2-pentanone = 2.19% and median aCSF = 0.14%, 4 responding cells out of 6; median 25 mM DMDS = 0.63% and median aCSF = 0.04%, 3 responding cells out of 6; median 50 mM DMDS = 39.72% and median aCSF = −0.39%, 9 responding cells out of 10). Boxplot represents IQR ± minimum/maximum sans outliers. Figure S2 shows similar results for bitter compounds that do not activate CSF-cNs, suggesting some specificity. See also Figure S2 and Video S2. |
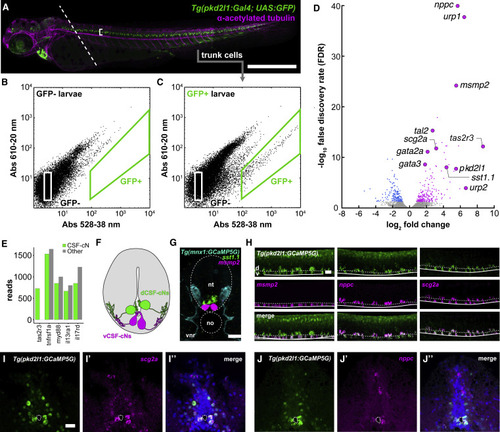
Figure 4. The CSF-cN transcriptome reveals the expression of taste receptors and immune-related secreted factors (A) 3 dpf zebrafish Tg(pkd2l1:GAL4; UAS:GFP) larva immunostained for GFP (green) and acetylated tubulin (magenta). Dashed line indicates plane of decapitation prior to dissociation (anterior tissues were discarded to exclude labeled cells in brain and heart); bracket indicates CSF-cN domain. Scale bars, 500 μm. (B) Calibration FACS plot from non-transgenic siblings. (C) FACS plot from a typical dissociation of cells from transgenic larvae. A small fraction (∼0.2% of input) of cells is green-shifted. Figure S3 quantifies the upper bound of cells/larvae we could reasonably expect to obtain. In Figure S4A, we use qPCR to show that this fraction appeared to be CSF-cNs. (D) Volcano plot of all RNA-seq replicates: 202 transcripts were enriched in CSF-cNs. Figure S4B provides more categorical information on these hits. Figure S6 shows that knocking out individual CSF-cN-enriched taste receptors identified by this approach did not impair CSF-cNs’ ability to detect bitter compounds. (E) Quantification of reads for selected immune-related receptors in both GFP+ CSF-cNs and GFP− (i.e., all other) cells. (F) Schematic representation of a transverse section of the spinal cord and central canal showing the disposition of dorsolateral CSF-cNs (dCSF-cNs, green) and ventromedial CSF-cNs (vCSF-cNs, magenta). (G) A mixed fluorescence in situ hybridization/immunofluorescent stain showing the disposition of motor neurons (cyan, Tg(mnx1:GCaMP5)), dCSF-cNs (green, sst1.1), and vCSF-cNs (magenta, msmp2). The section here is a frontal section, e.g., a cross-section of the spinal cord. Scale bars, 50 μm. (H) Fluorescence in situ hybridization reveals that the putative immune-related secreted factors msmp2, nppc, and scg2a are expressed in CSF-cNs. These confocal stacks are lateral stacks, so at 90° orientation to the image in (G). Scale bars, 50 μm. Figure S5 shows additional in situ hybridization results from some of these RNA-seq hits; most hits we assessed were verified histologically. (I) Transverse section of adult Tg(pkd2l1:GCaMP5G) spinal cord; expression of scg2a is specific to CSF-cNs. Scale bars, 50 μm. (J) Adults continue to express nppc and scg2a in CSF-cNs. See also Figures S3–S6, Table S1, and Data S1. |

Figure 5. RNA-seq shows upregulation of complement system of the alternative and terminal pathway as well as cytokines in CSF-cNs during S. pneumoniae infection (A) Log fold change bar plot comparing enrichment of known CSF-cN transcripts in the GFP+ fraction with control GFP− cells in the original differential transcriptome 1 (gray bars; see Figure 4 and Table S1) and subsequent transcriptome 2 for non-infected larvae (black bars; see Table S1). (B) A plot of raw reads comparing selected receptors in non-infected (gray bars) and infected (pink bars) CSF-cNs, showing that the expression of receptors that are specifically enriched in CSF-cNs (pkd2l1, pkd1l2, and taste receptors) remains stable. (C) Volcano plot comparing the expression of transcripts in infected CSF-cNs relative to uninfected CSF-cNs. Transcripts for several immune-related secretory compounds are differentially expressed. (D) Log fold change bar plot of selected immune-related transcripts corresponding to complement system and cytokines from the same data as in (B). We observe significant upregulation of complement system of the alternative (C3), classical (C4), and terminal (C6) pathway (left side) as well as cytokines (right side). See also Table S1 and Data S1. |
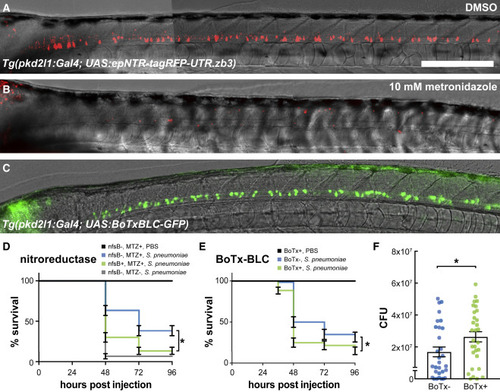
Figure 6. Secretory activity of CSF-cNs confers a survival benefit during pneumococcal meningitis (A) Tg(pkd2l1:GAL4; UAS:epNTR-tagRFPT-UTR.zb3) larva at 3 dpf following 24 h of incubation in 0.1% DMSO. Scale bars, 500 μm. Figure S3 addresses how complete NTR expression is in the full complement of CSF-cNs. (B) Sibling larva incubated for the same time period in 10 mM metronidazole (MTZ). All tagRFP+ CSF-cNs are lost. (C) Expression of BoTxBLC-GFP in the Tg(pkd2l1:GAL4; UAS:BoTxBLC-GFP) larva at 3 dpf. (D) Survival curves of Tg(pkd2l1:GAL4; UAS:epNTR-tagRFPT-UTR.zb3)(nfsB) larvae and their siblings when exposed to metronidazole or DMSO from 1 to 2 dpf, washed with fish facility water, and subsequently infected with 4,000 CFU S. pneumoniae. Metronidazole alone slightly protects larvae against infection by S. pneumoniae (compare blue and gray lines, log-rank test, p < 0.0001). However, metronidazole-mediated ablation of CSF-cNs confers a large survival deficit (compare blue and green lines, log-rank test, p = 0.0002). The survival data represent the mean ± SEM of three individual experiments with n = 20 larvae per group (total n = 60 per group). (E) Survival curves of Tg(pkd2l1:GAL4; UAS:BoTxBLC-GFP) ("BoTx") larvae (green line) and non-transgenic sibling controls (blue line) injected with ∼300 CFU S. pneumoniae D39 wild-type strain into the hindbrain ventricle at 2 dpf reveal that BoTx-expressing larvae exhibit higher mortality rates (log-rank test, p = 0.0065). The survival data represent the mean ± SEM of three individual experiments with n = 20 larvae per group (total n = 60 per group). Figure S7 shows that knocking out individual secreted factors identified by the transcriptome does not impair larval survival in the meningitis model. (F) Tg(pkd2l1:GAL4; UAS:BoTxBLC-GFP) (referred to as “BoTx”) larvae (green line) exhibit higher bacterial loads at 24 h post injection as compared with non-transgenic sibling controls (unpaired t test, p = 0.0368). Each dot represents a single larva. Error bars = mean ± SEM of three individual experiments with n = 10 larvae per group (total n = 30 per group). See also Figures S3 and S7 and Table S1. |
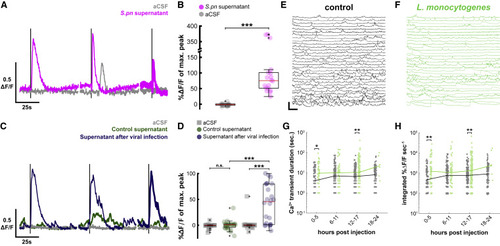
Figure 7. Streptococcus pneumoniae supernatant, virus culture supernatant, and Listeria monocytogenes infection also activate CSF-cNs (A) Representative individual in vitro CSF-cN Ca2+ traces from 3 successive 1-s stimulations of aCSF (gray) and supernatant (purple). Dark lines correspond to 1-s stimulations. Vertical scale, 0.5 ΔF/F; horizontal scale, 25 s. (B) Quantification of calcium transients after aCSF (gray circle) or S. pneumoniae supernatant (purple circle) stimuli. Paired t test, p = 5.0 × 10⁻⁴, ∗∗∗p < 0.001. Red bar: median ΔF/F (median S. pneumoniae supernatant = +75.35% versus median aCSF = −0.73%, n = 6 cells). Boxplot represents IQR + minimum/maximum sans outliers. (C) Representative individual in vitro CSF-cN Ca2+ traces from 3 successive 1-s stimulations of aCSF (gray), UV-inactivated supernatant of BHK cells infected with Sindbis virus (blue), and control BHK supernatant (green). Dark lines correspond to 1-s stimulations. Vertical scale, 0.5 ΔF/F; horizontal scale, 25 s. (D) Quantification of calcium transients after aCSF (gray circle), control supernatant (green circle), or supernatant after viral infection (blue) stimuli. Two-factor ANOVA, treatment factor F = 24.52, p = 3.32 × 10⁻⁶, Tukey HSD post hoc testing, ∗∗∗p < 0.001. Red bar: median ΔF/F (median control supernatant = +0.82% versus median aCSF = −0.26%, n = 8 cells; median supernatant after virus infection = 45.63% versus median SF = −0.22%, n = 7 cells; median 100 mM DMDS = 112.09% versus median aCSF = −0.54%, n = 8 cells. (E) In vivo Ca2+ activity of CSF-cNs in uninfected larvae 8 h after injection in the brain ventricle. Vertical scale, 250% ΔF/F; horizontal scale, 20 s. (F) Long-lasting and large calcium transients from larvae infected with L. monocytogenes occur in a similar manner as with S. pneumoniae. (G) Quantification of duration of software-detected high-amplitude transients in control (gray) and L. monocytogenes-infected (green) larvae (Wilcoxon signed-rank test, ∗p < 0.0125, ∗∗p < 0.0063). Lines indicate median values. (H) Similar quantification of integrated signal of large transients during L. monocytogenes infection. See also Table S1. |