
Fig. 7
- ID
- ZDB-FIG-230809-13
- Publication
- Prendergast et al., 2023 - CSF-contacting neurons respond to Streptococcus pneumoniae and promote host survival during central nervous system infection
- Other Figures
- All Figure Page
- Back to All Figure Page
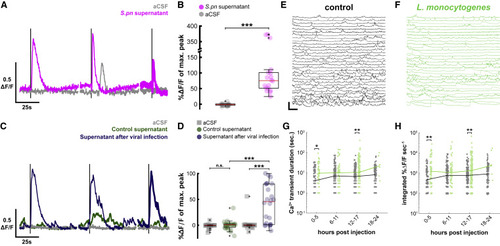
Figure 7. Streptococcus pneumoniae supernatant, virus culture supernatant, and Listeria monocytogenes infection also activate CSF-cNs (A) Representative individual in vitro CSF-cN Ca2+ traces from 3 successive 1-s stimulations of aCSF (gray) and supernatant (purple). Dark lines correspond to 1-s stimulations. Vertical scale, 0.5 ΔF/F; horizontal scale, 25 s. (B) Quantification of calcium transients after aCSF (gray circle) or S. pneumoniae supernatant (purple circle) stimuli. Paired t test, p = 5.0 × 10⁻⁴, ∗∗∗p < 0.001. Red bar: median ΔF/F (median S. pneumoniae supernatant = +75.35% versus median aCSF = −0.73%, n = 6 cells). Boxplot represents IQR + minimum/maximum sans outliers. (C) Representative individual in vitro CSF-cN Ca2+ traces from 3 successive 1-s stimulations of aCSF (gray), UV-inactivated supernatant of BHK cells infected with Sindbis virus (blue), and control BHK supernatant (green). Dark lines correspond to 1-s stimulations. Vertical scale, 0.5 ΔF/F; horizontal scale, 25 s. (D) Quantification of calcium transients after aCSF (gray circle), control supernatant (green circle), or supernatant after viral infection (blue) stimuli. Two-factor ANOVA, treatment factor F = 24.52, p = 3.32 × 10⁻⁶, Tukey HSD post hoc testing, ∗∗∗p < 0.001. Red bar: median ΔF/F (median control supernatant = +0.82% versus median aCSF = −0.26%, n = 8 cells; median supernatant after virus infection = 45.63% versus median SF = −0.22%, n = 7 cells; median 100 mM DMDS = 112.09% versus median aCSF = −0.54%, n = 8 cells. (E) In vivo Ca2+ activity of CSF-cNs in uninfected larvae 8 h after injection in the brain ventricle. Vertical scale, 250% ΔF/F; horizontal scale, 20 s. (F) Long-lasting and large calcium transients from larvae infected with L. monocytogenes occur in a similar manner as with S. pneumoniae. (G) Quantification of duration of software-detected high-amplitude transients in control (gray) and L. monocytogenes-infected (green) larvae (Wilcoxon signed-rank test, ∗p < 0.0125, ∗∗p < 0.0063). Lines indicate median values. (H) Similar quantification of integrated signal of large transients during L. monocytogenes infection. See also Table S1. |