
Fig. 2
- ID
- ZDB-FIG-230809-8
- Publication
- Prendergast et al., 2023 - CSF-contacting neurons respond to Streptococcus pneumoniae and promote host survival during central nervous system infection
- Other Figures
- All Figure Page
- Back to All Figure Page
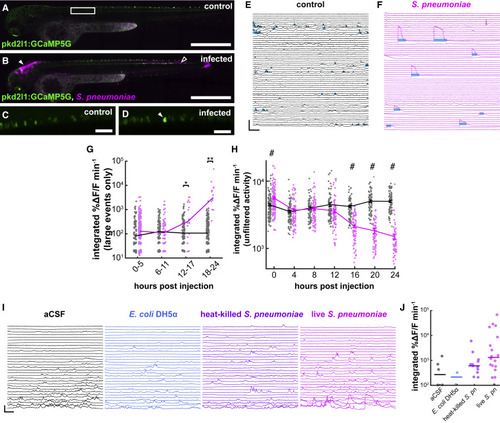
Figure 2. Activity of CSF-cNs drastically changes in response to the invasion of Streptococcus pneumoniae into the CSF (A) Untreated 3 dpf Tg(pkd2l1:GCaMP5G) larva. Box indicates field of view for (C) and (D). Scale bars, 500 μm. (B) Sibling larva, 24 hpi of fluorescently labeled S. pneumoniae into the hindbrain ventricle (HBV, indicated by filled arrowhead); empty arrowhead indicates extent of bacterial proliferation. (C) Higher magnification image of control CSF-cN calcium imaging. Scale bars, 50 μm. (D) Comparable image from an infected larva with S. pneumoniae. Arrowhead indicates a CSF-cN undergoing a high-amplitude transient. (E) Ca2+ activity plots of uninfected CSF-cNs 21 h after the beginning of the experiment. Cyan bars indicate detected long-lasting high-amplitude events. Vertical scale, 500% ΔF/F; horizontal scale, 20 s. These events precede the arrival of neutrophils (Figure S1). (F) Similar plots from CSF-cNs of infected larvae showing high-amplitude transients. (G) Quantification of software-detected high-amplitude transients in control (gray) and S. pneumoniae-infected (magenta) larvae. Large transients appear 12 hpi (lines represent median values, Wilcoxon signed-rank test, ∗p < 0.0125, ∗∗p < 0.0063). (H) Integrated Ca2+ activity in CSF-cNs in control (gray) and infected (magenta) larvae over 24 h of infection. Overall activity undergoes a decline over the course of infection (two-factor ANOVA, injection factor F = 124.36, p = 1.61 × 10⁻²⁷, Scheffé post hoc testing, #p < 0.05, data are represented as mean ± SEM). (I) Individual CSF-cN Ca2+ traces from 2 dpf zebrafish injected with aCSF, DH5α Escherichia coli, heat-killed S. pneumoniae, and live S. pneumoniae. Injection with live S. pneumoniae elicits by far the largest transients. Vertical scale, 200% ΔF/F; horizontal scale, 25 s. (J) Quantification of software-detected large transients from the four conditions in (M); lines represent median values. More transients are observed in live infected fish than the other three conditions (chi-square test, p = 6.28E−16). See also Figure S1, Table S1, and Video S1. |