|
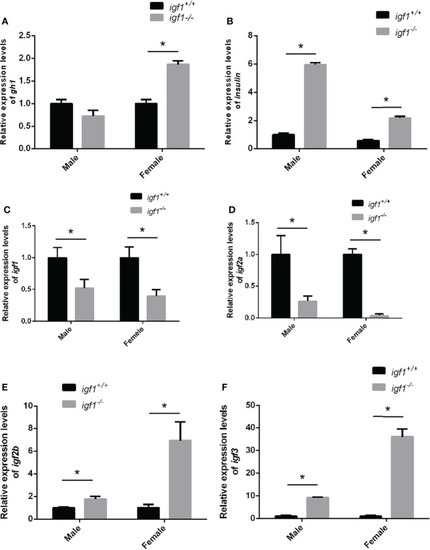
Feeding-back transcriptional levels of igf1 gene (A, B) Relative expression levels of gh1(A) and insulin(B) in igf1-deficient fish and the control wild-type fish and three biological repeats were carried out and statistical analysis was performed using a t test (n=3). (C–F) Relative expression levels of igf1, igf2a, igf2b and igf3 in igf1-deficient fish and the control wild-type fish and three biological repeats were carried out and statistical analysis was performed using a t test (n=3). There was no difference between the two internal reference gene (β-actin and EF1α). Four animals were sampled for each experiment and three biological repeats were carried out and statistical analysis was performed using a t test. The asterisk "*" represented significant difference, P<0.05.
|