Fig. 9
|
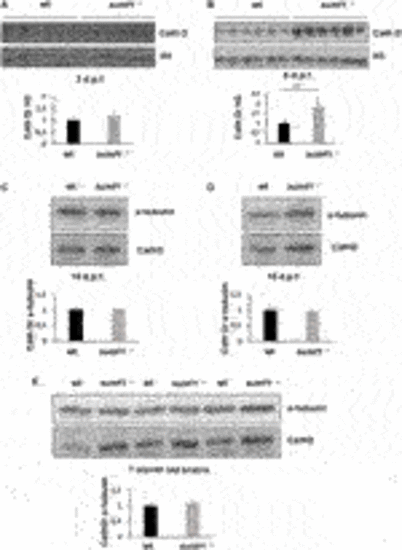
FIGURE 9. Cathepsin D protein levels as an indicator of lysosome digestive capacity. Western blotting was performed in larvae of different ages (3, 5, 10, and 15 d.p.f.) and on brains of adult zebrafish to measure the levels of the mature form of cathepsin D (37 kDa band presented) as an indicator of the digestive capacity of lysosomes. (A) No differences in cathepsin D were observed between wildtype (wt) and sumf1−/− fish at 3 d.p.f. The levels of cathepsin D are significantly increased at 5 d.p.f. in the sumf1−/− fish relative to wt fish (B) whereas no differences were observed between the different genotypes at 10 d.p.f. (C), 15 d.p.f. (D) and in the brains of adult fish (7 months old), (D). Graphs show mean values (± SEM) of densitometry of cathepsin D normalised to histone 3 (loading control at 3 d.p.f and 5 d.p.f.) and α-tubulin (loading control at 10 d.p.f. and 15 d.p.f. larvae and 7 months old brain) from at least 3 independent experiments. Statistical analysis was performed using a two-tailed t-test. ***p < 0.001. |
| Fish: | |
|---|---|
| Observed In: | |
| Stage Range: | Protruding-mouth to Adult |

