FIGURE

FIGURE 3

ID
ZDB-FIG-210319-62
Publication
Vishnolia et al., 2021 - sGC Activity and Regulation of Blood Flow in a Zebrafish Model System
Other Figures
All Figure Page
Back to All Figure Page
FIGURE 3

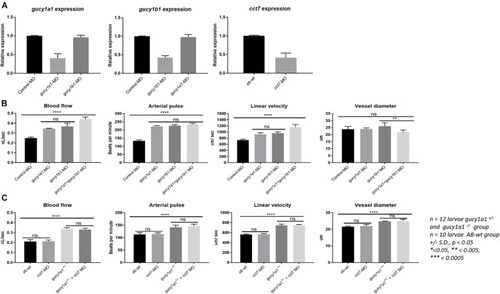
(A) Graphs represent mRNA downregulation of gucy1a1, gucy1b1, and cct7 genes using morpholino (MO) in zebrafish. No cross reactivity of morpholinos was observed between the two subunits of gucy gene in the mRNA expression. (B) Graphs represent comparison of blood flow parameters measured from gucy1a1 (n = 12), gucy1b1 (n = 12), gucy1a1+gucy1b1 (n = 12), and control-MO (n = 10). (C) Graphs presenting comparison of blood flow parameters measured from AB-wild-type (n = 10), cct7-MO (n = 12), gucy1a1+/– (n = 12), and gucy1a1+/– + cct7-MO (n = 12). Data are presented as mean ± standard deviation, significance was set at p < 0.05, and stars denote the significant differences.

Expression Data
Genes:
Fish:
Knockdown Reagents:
Anatomical Term:
Stage: Adult

Expression Detail
Antibody Labeling
Phenotype Data
Fish:
Knockdown Reagents:
Observed In:
Stage: Adult

Phenotype Detail
Acknowledgments
This image is the copyrighted work of the attributed author or publisher, and ZFIN has permission only to display this image to its users. Additional permissions should be obtained from the applicable author or publisher of the image. Full text @ Front. Physiol.